全文HTML
--> --> -->LED热阻是各类照明领域中重要的研究方向, 目前针对半导体器件热阻测量的主要方法有: 红外热像仪法、电学参数法及光谱峰值漂移法[ 12]和蓝白比法等[ 9, 10, 13]. 这些方法根据热阻的定义, 基于不同的工作原理, 均可测出半导体器件的稳态热阻, 但是这些方法都需要专用设备或者昂贵的测试系统. 其中电学参数法中的正向压降法是目前业界最常用的LED热阻测量方法, 但采用正向电压法测LED热阻时很容易受到封装结构和灯具外壳的限制, 难以精确测量LED PN结的结电压[ 14], 并且其定标过程是在极小电流下进行的, 所以要得到精确的稳态热阻, 需要高精度的数据采集系统, 使得相应的测量设备昂贵. 另外根据PN正向电压与工作电流和结温的函数关系可知: 其结电压与结温的函数关系在高温端要明显优于低温端, 引起各种测量误差, 从而无法有效掌握稳态热阻情况. 而采用光谱峰值漂移法, 由于LED结温变化引起峰值漂移量并不大[ 15], 若采用高精度的光谱仪, 必会大大增加成本; 并且如GaN基蓝光LED峰值随结温先减小后增大, 这样给稳态热阻的测试必会带来不少的误差. 蓝白比法是利用蓝光芯片的激发效率和荧光粉的转化效率降低程度不一致来实现LED结温测量的[ 6, 10], 随着荧光粉转化效率的提高, 这种不一致越来越小, 而荧光粉产生的转化效率受功率和温度等多重因素的影响, 不能稳定地表征结温, 从而影响热阻测量的精度. 且蓝白比法仅适用于小电流情况下InGaN+YAG单一型荧光粉转化的白光LED热阻的测量[ 16], 所以需要高精度的光谱仪, 造成测量成本的大幅提高, 这些因素使得此类方法测LED稳态热阻的应用均受到了一定程度的限制[ 17].
本文以功率型高低色温白光LED器件为研究对象, 采用常规光谱仪采集正常驱动流下的LED发光光谱数据, 分析LED光谱波谷处的相对光谱强度, 通过一定的定标函数拟合得出其结温, 从而提出一种测量LED稳态热阻的新方法. 本方法采用非传统式光谱法的测量方式, 避免了类似传统的正向电压法和蓝白比法采用极小电流定标而分别需要高精度数据采集系统和高灵敏度的光谱仪以及对LED封装结构有一定限制的劣势, 具有成本低、比传统的非接触法更高的测量精度、更广的适用范围和可远程实时在线检测LED稳态热阻的优势.
按标准, LED整体稳态热阻(Rth)定义是: 在热平衡条件下沿LED器件热流通道上单位热耗散功率引起的PN结温与基底的温差[ 18], 数学表达式为
目前测量LED稳态热阻的方法较多, 其中以正向压降法为业界主流的测量方法, 但此方法存在一定的局限性: 1)无法实时在位检测LED热阻; 2)对LED封装结构有一定的要求; 3)为了减少自加热效应引起的误差, 须在极小测试电流和高速电压采样速率下进行标定, 对设备的精度要求较高而使得设备价值昂贵. 这些因素造成此方法在业界的使用受到一定的限制.
从白光LED工艺流程上看, 业界通常采用蓝光芯片涂覆黄色荧光粉的封装工艺, 其产生白光的机理是: 蓝光芯片在正常的电流驱动下复合辐射发出蓝光, 一部分蓝光激发荧光粉产生黄光, 一部分透过荧光粉的蓝光与被激发出的黄光混合而成白光[19]. 在激发的过程中伴随着三类热量的产生: 1)蓝光芯片工作时产生的热量; 2)蓝光激发荧光粉产生一定的热量; 3)蓝光透过荧光粉与黄光混合时产生相应的热量[ 20]. 这些热量会引起LED结温的升高, 而结温的升高又会导致蓝光和黄光光谱产生一定的漂移, 从而蓝光和黄光光谱的漂移均带有一定的温度特性. 如采用峰值波长和主波长随温度的漂移来表征结温, 结温每变化100 ℃, 峰值波长约变化 ±3 — ±4 nm, 且主波长随温度变化还要小于峰值波长随温度的变化, 采用此方法来测量结温在理论上具有可操作性, 在实际中采用常规的光谱仪会带来较大的误差. 但在同样的驱动电流下, 随着LED结温越高, 蓝光与黄光光谱均不同程度地变宽, 从而蓝光光谱与黄光光谱曲线的交点(即波谷点)在归一化光谱图上变高明显, 从而白光LED波谷处的归一化相对光谱强度增大较显著. 从 图1光谱图可以看出, 蓝光与黄光两光谱交点(A点), 即整个光谱波谷点的归一化相对光谱强度能更全面地表征两光谱随温度的变化情况, 因此波谷处的归一化相对光谱强度能更全面、更精确地反映LED结温的变化, 从而通过归一化相对光谱强度的变化能更便捷地反映出LED热扩散通道上的稳态热阻情况. 采用此种方式, 既能反映蓝光度随温度的变化情况, 又能体现温度使黄光产生漂移的程度, 同时不影响测量的精度.
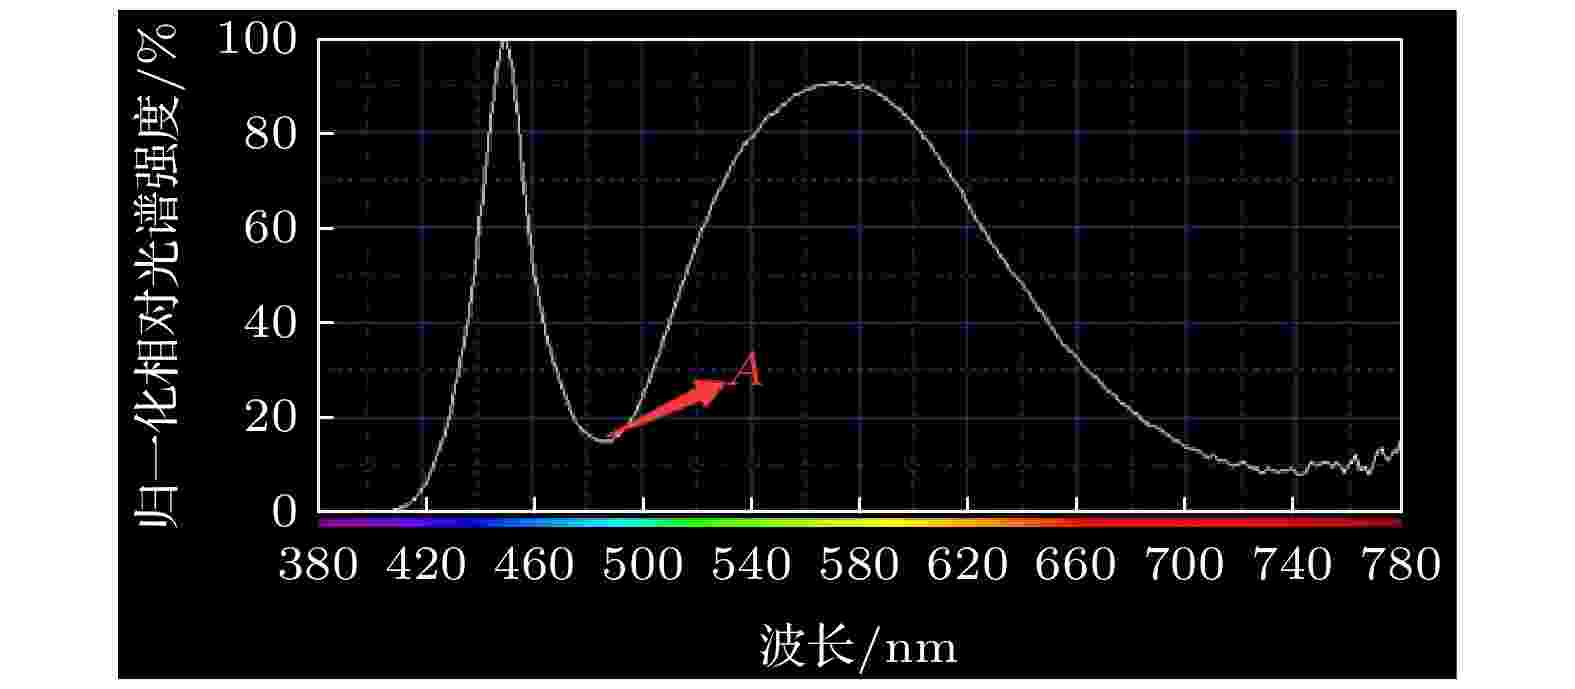 图 1 采用蓝光激发荧光粉产生白光的LED光谱图
Figure1. Spectrgoram of white LED with phosphor excited by blue light.
通过理论和实验可得出, 将离散的光谱数据在波谷附近处拟合成连续函数, 得出白光LED发光光谱处波谷归一光谱强度IA随白光LED结温Tj的变化近似呈现如下关系:
在施加驱动电流前LED器件处于热平衡状态, 其基底温度Ta和器件的芯片温度保持一致, 则Tj = Ta, 当在正常的驱动电流下工作时, 结温Tj升高, 达到热平衡状态后, 便可通过LED的热耗散功率Pt将LED整体稳态热阻的表达式等效为
2
3.1.定 标
1)将待测白光LED器件基底均匀涂覆一薄层导热硅脂, 并安装在恒温器中;2)将恒温器温度设定为T1, 稳定一定时间, 使LED 基底与发光芯片以及恒温器之间处于稳定的热平衡状态;
3)给白光LED 器件正常的驱动电流(如350 mA), 并快速启动光谱仪测量其发光光谱, 得到光谱最低点A的相对光谱强度;
4)设定恒温腔的温度为Ti (i = 2, 3, ···), 经历一定的时间后, 重复步聚3), 得到在不同温度条件下发光光谱最低点(即波谷)的相对光谱强度IA.
从LED器件开始工作到光谱仪采集到其发光光谱数据虽然时间较短, 由于定标过程中均采用高达数百毫安的正常工作电流, 对待测LED自身的自加热效应不可忽略. 由于所采用的常规光谱仪的积分时间固定在微秒量级, 在同样的工作电流下和固定较短的积分时间内其结温的增量近乎是一致的, 为了减少自加热效应和温控器精度的影响, 选定某一状态(如25 ℃)为基准状态, 对应的温度为Tb, 光谱最低点A的相对光谱强度为Ib, 将步骤4)得出的Tj和IA分别与基准值作差得到?Tj = Tj – Tb和IA = ?IA – Ib, 通过拟合, 得到线性定标函数?Tj = K(?IA), 其中K为波谷处归一化相对光谱强度-结温系数.
2
3.2.结温测量
获取实际LED正常工作时任一状态下的结温Tj的步骤如下:1)通过光谱仪测量待测条件下LED光谱分布, 得到光谱最低点A的相对光谱强度值IA;
2)将测得的IA值与基准Ib作差得到?IA;
3)将计算出的?IA代入到定标函数?Tj = f (?IA), 得到此时的真实结温Tj = Tb + ?Tj = Tb + f (?IA).
2
3.3.热耗散功率测量
在正常驱动电流下, 注入LED的电功率P主要分成发光光功率P0和使LED器件温度升高的热耗散功率Pt两部分, 大多数光谱仪在测量发光光谱的同时能直接得出相应状态下的电功率P和发光光功率P0, 得到热耗散功率Pt = P – P0.2
3.4.稳态热阻测量
通过光谱法得到达到热平衡时的结温Tj与未施加驱动电流时LED芯片的温度Ta之差便得结温的温升?Tj, 其与热耗散功率P之比便是LED稳态热阻.4.1.样品选择
实验采用改变一定功率的恒温器的温度进而改变LED基底温度的方式来改变结温进行定标, 从而研究白光LED光谱波谷处的相对强度与结温间的关系. 为了说明本方法的普适性, 实验随机选取不同厂家的多种大功率高低色温白光LED作为研究对象. 为了减小基底与恒温器间接触给稳态热阻测量造成的影响, 实验前在基底上均匀填涂导热硅脂.2
4.2.实验装置
本实验测量系统由ATA-500型光谱, CL-200恒控器、积分球以及WY305型恒流电源等组成. WY305型恒电源负责给LED样品提供稳定的驱动电流, 其误差范围为 ± 0.1 mA. CL-200恒温器(功率可调)为器件提供稳定的测试温度, 其误差范围为± 1 ℃. ATA-500型光谱可快速采集可光见范围内的光谱, 其精度为0.3 nm, 积分时间为9 ms, 测试系统结构图如图2所示.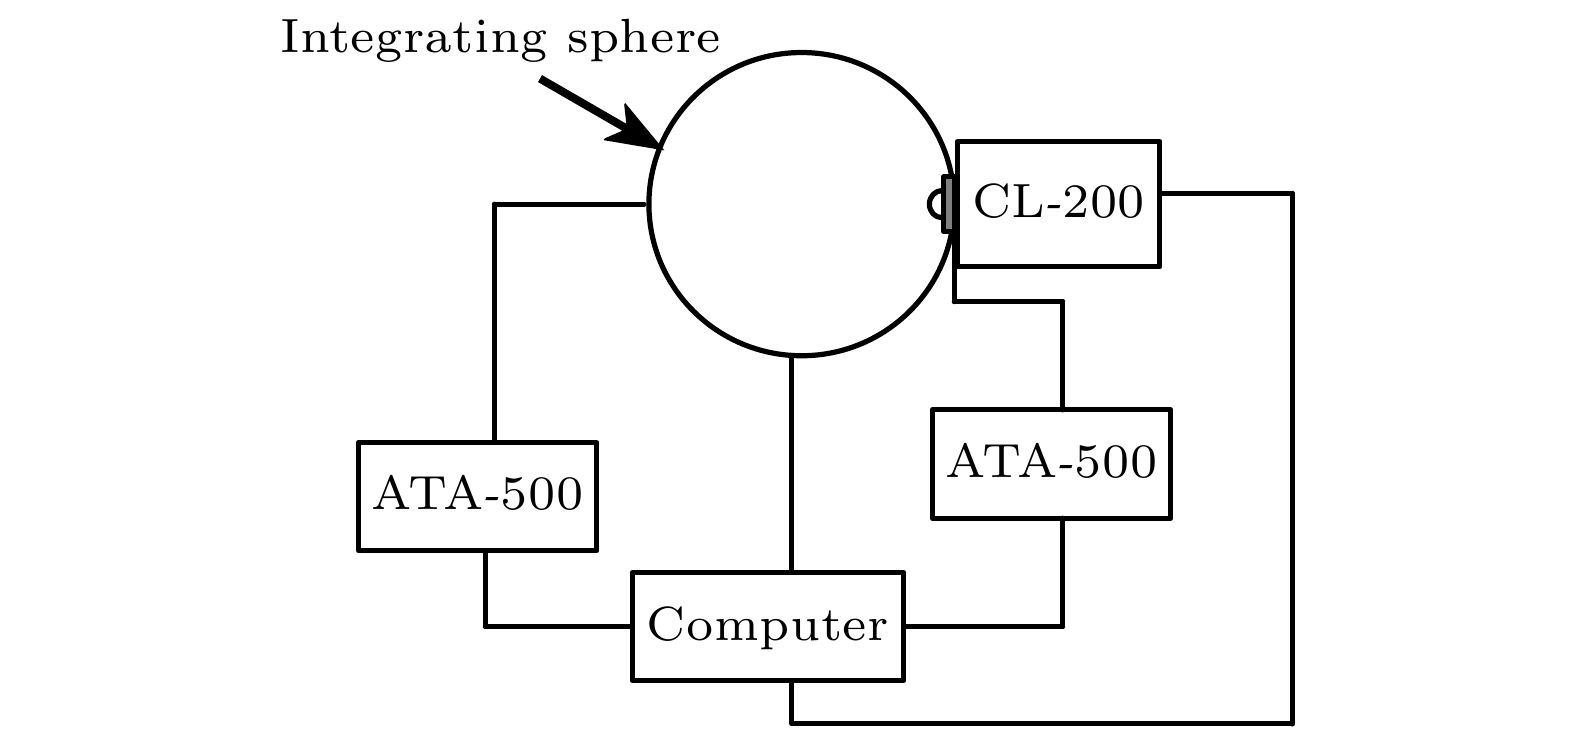 图 2 基于光谱法的LED稳态热阻测量系统示意图
Figure2. Schematic diagram of LED steady-state thermal resistance measurement system based on spectrum method.
2
4.3.实验过程
将白光LED器件安装在恒温器上, 并用导热硅脂均匀填充在器件基底与恒温器基底间, 系统装置如 图2, 测量步骤如下:1)通过恒温器将LED分别在5—85 ℃, 温度步径为5 ℃的状态下稳定一定时间, 使LED器件基底、芯片和恒温器达到稳定的热平衡, 再以正常的工作电流350 mA驱动LED, 测量其发光光谱, 将光谱数据进行一定的拟合得到对应波谷处的相对发光强度, 并与基准状态下波谷处的发光强度作差, 从而得到白光LED的波谷处相对光谱强度-结温系数K;
2)通过恒温器将LED基底保持稳定室温Tc条件下, 以正常工作电流点亮LED一段时间后, 测量其发光光谱, 得到光谱波谷处的相对光谱强度, 根据光谱强度-结温系数K, 从而得出此条件下LED的结温, 并记录其工作时的输入电功率P和光功率P0;
3)采用如下公式计算出白光LED稳态热阻:
2
5.1.大功率高色温白光LED
采用图2所示的稳态热阻测量系统对一大功率高色温(相关色温Tc = 8356 K)白光LED进行了热阻测试, 首先测出其在不同结温环境下发光光谱波谷处相对光谱强度数据, 如 表1所列.| 温度 ?T/℃ | |||||||||||||||||
| 5 | 10 | 15 | 20 | 25 | 30 | 35 | 40 | 45 | 50 | 55 | 60 | 65 | 70 | 75 | 80 | 85 | |
| 波谷相对强度?I/% | 9.98 | 10.24 | 10.63 | 10.99 | 11.32 | 11.64 | 12.03 | 12.44 | 12.74 | 13.10 | 13.51 | 13.87 | 14.27 | 14.66 | 14.97 | 15.44 | 15.82 |
表1不同温度下高色温白光LED光谱波谷相对强度
Table1.Relative strength of spectral trough of white LED with high color temperature at different temperatures.
为了减小由正常的驱动电流引起的自加热效应和温控器对温度控制的不确定度而带来的误差, 将结温处于Tc = 25 ℃时的状态选定为基准状态, 测得数据如 表2所列.
| 温度差 T/℃ | |||||||||||||||||
| –20 | –15 | –10 | –5 | 0 | 5 | 10 | 15 | 20 | 25 | 30 | 35 | 40 | 45 | 50 | 55 | 60 | |
| 波谷归一化强度差I/% | –1.34 | –1.08 | –0.69 | –0.33 | 0 | 0.32 | 0.71 | 1.12 | 1.42 | 1.78 | 2.19 | 2.55 | 2.95 | 3.34 | 3.65 | 4.12 | 4.50 |
表2相对于基准状态下, 不同温度下高色温白光LED光谱波谷相对强度
Table2.Relative strength of spectral trough of white LED with high color temperature at different temperatures to reference state.
将与基准状态下对比后的相对光谱强度与结温间的关系进行拟合, 得到如 图3所示的定标曲线, 并得到定标函数y = 13.624x – 0.2033, 其中线性相关系数R2 = 0.9992, 拟合出的线性度相当高, 此定标函数的系数13.624即为谷处归一化光谱强度-结温敏感系数K.
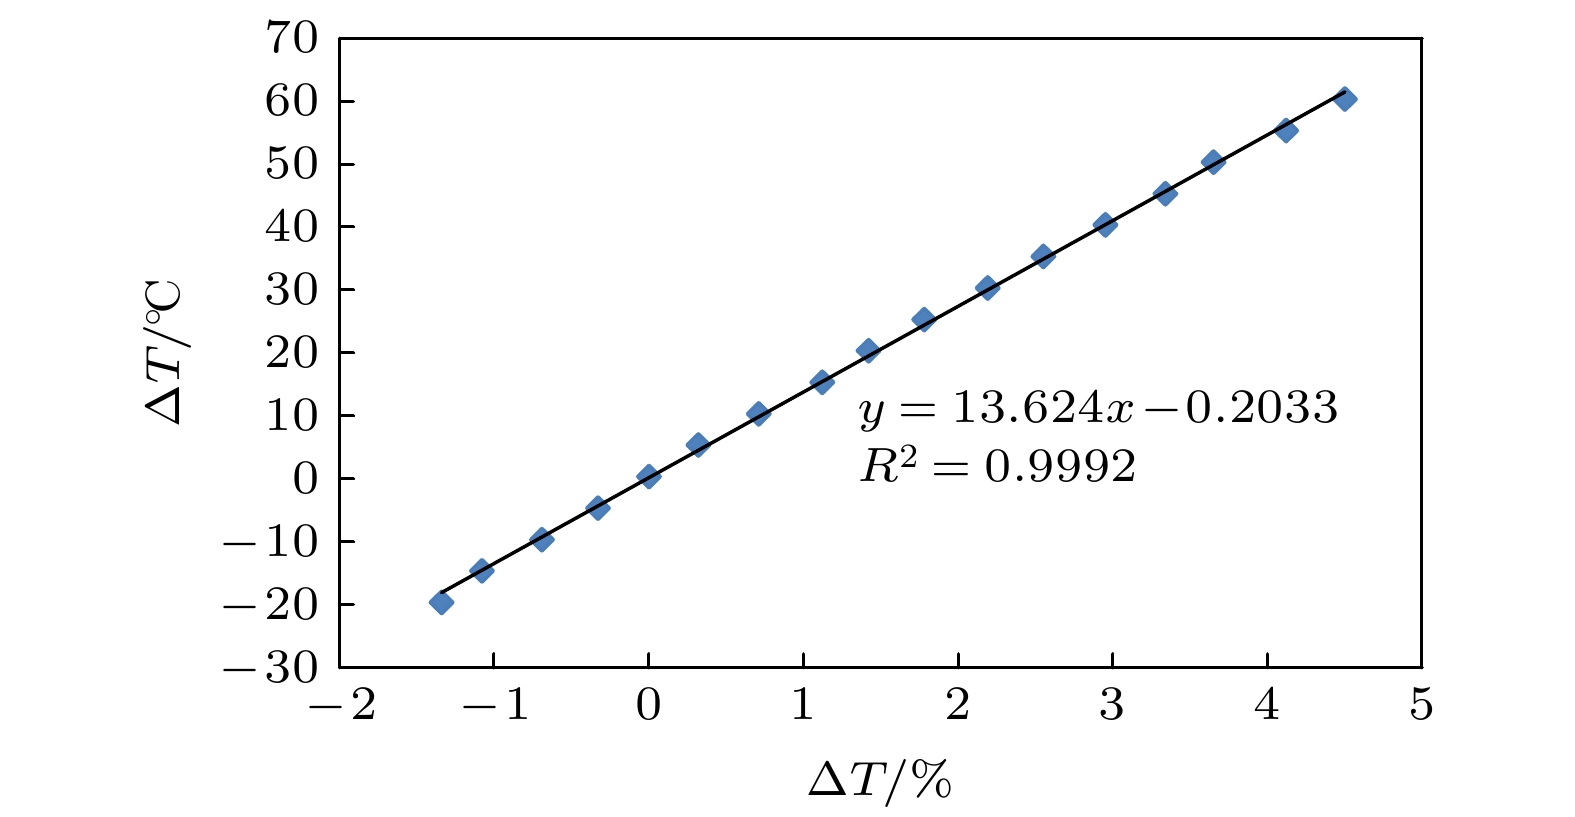 图 3 高色温LED定标函数曲线图
Figure3. Calibration function curve of high color temperature LED.
再通过恒温器将LED基底保持在25 ℃环境中, 以350 mA的驱动电流点亮LED, 每隔20 s测量其发光光谱, 得到光谱波谷处的相对光强, 将其与基准状态下的波谷处的相对光强对比后, 代入定标函数y = 13.624x – 0.2033, 便可得出采用光谱法所测得的LED结温随工作时间的变化曲线, 如 图4所示. 发现当LED达到热平衡时, 结温Tj约为43.12 ℃. 同时测得LED正常工作时其输入电功率P为1235 mW, 发光光功率P0为326 mW, 得到LED工作时的热耗散功率Pt为909 mW, 根据公式

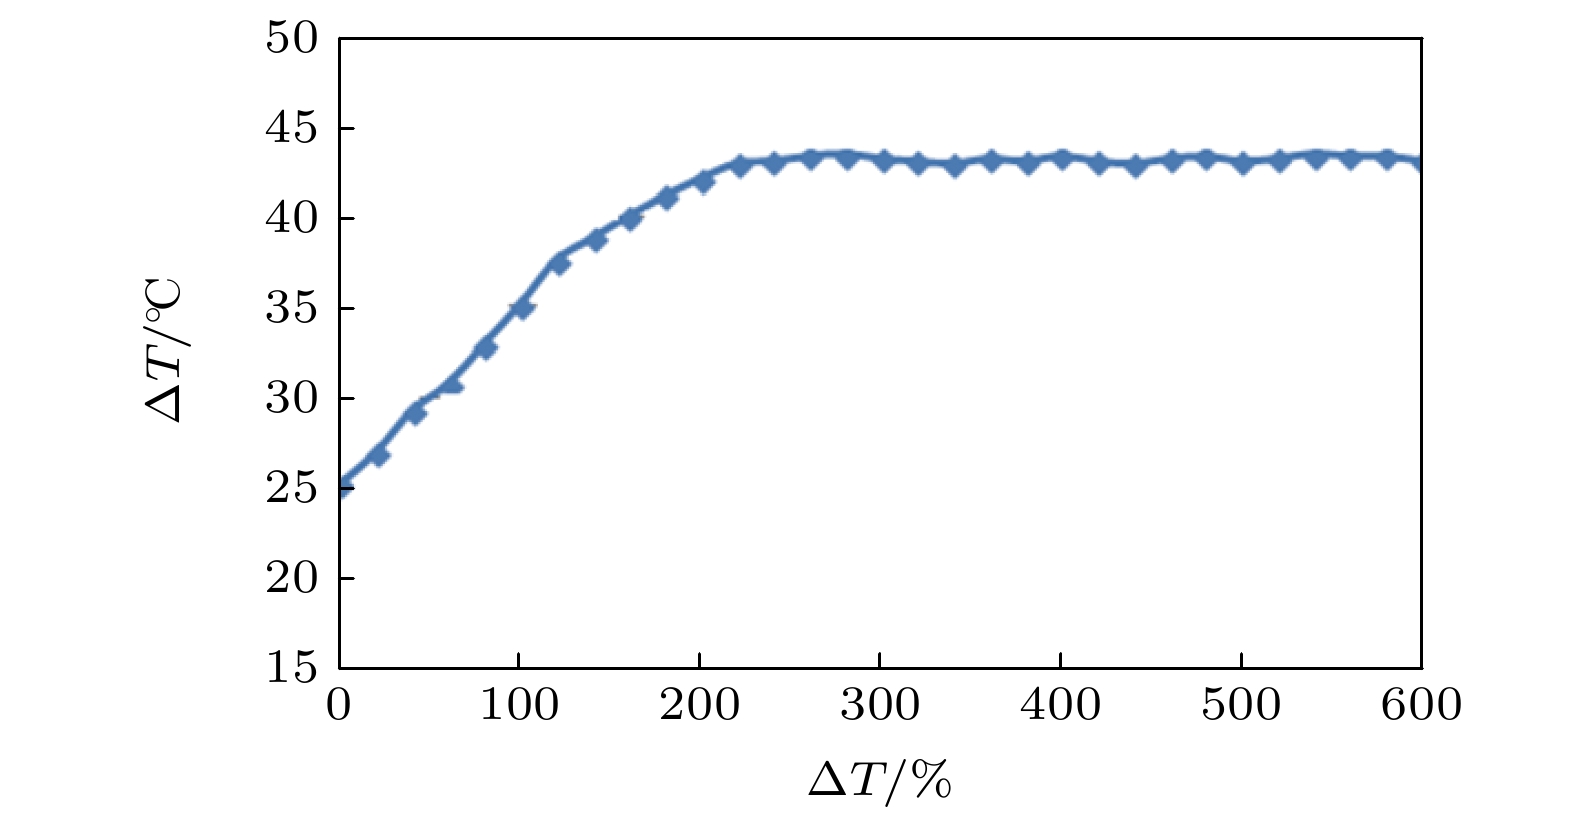 图 4 采用光谱法测得LED结温随时间变化曲线
Figure4. Curve of LED junction temperature with time measured by spectrum method.
2
5.2.大功率低色温白光LED
随机选取某款荧光粉含量较多的大功率低色温白光LED (相关色温Tc = 3240 K)作为研究对象, 采用 图2所示的系统测量其稳态热阻, 得到其发光光谱如 图5所示, 以25 ℃为基准状态得到相对光谱强度数据如 表3所列. 图 5 低色温归一化光谱相对强度分布Figure5. Relative intensity distribution of low color temperature normalized spectrum.
| 温度差?Tj/℃ | |||||||||||||
| –20 | –15 | –10 | –5 | 0 | 5 | 10 | 15 | 20 | 25 | 30 | 35 | 40 | |
| 波谷处归一化强度差?I /% | –1.20 | –0.83 | –0.54 | –0.15 | 0 | 0.33 | 0.70 | 0.97 | 1.36 | 1.68 | 1.94 | 2.41 | 2.71 |
表3不同温度下低色温白光LED光谱波谷相对强度
Table3.Relative strength of spectral trough of white LED with high color temperature at different temperatures.
将 表3中波谷处的归一化强度差?I与结温差?Tj通过二维坐标的形式呈现, 结果如 图6所示, 并通过线性拟合得到归一化强度差?I与结温差?Tj得到其定标函数y = 15.538x – 1.2111, 其中线性相关系数R2为0.9977, 线性程度大于0.99, 表明低色温大功率白光LED波谷处的归一化强度差?I和结温差?Tj仍具有较好的线性相关性, 此定标函数系数15.538即为波谷处归一化光谱强度-结温敏感系数K.
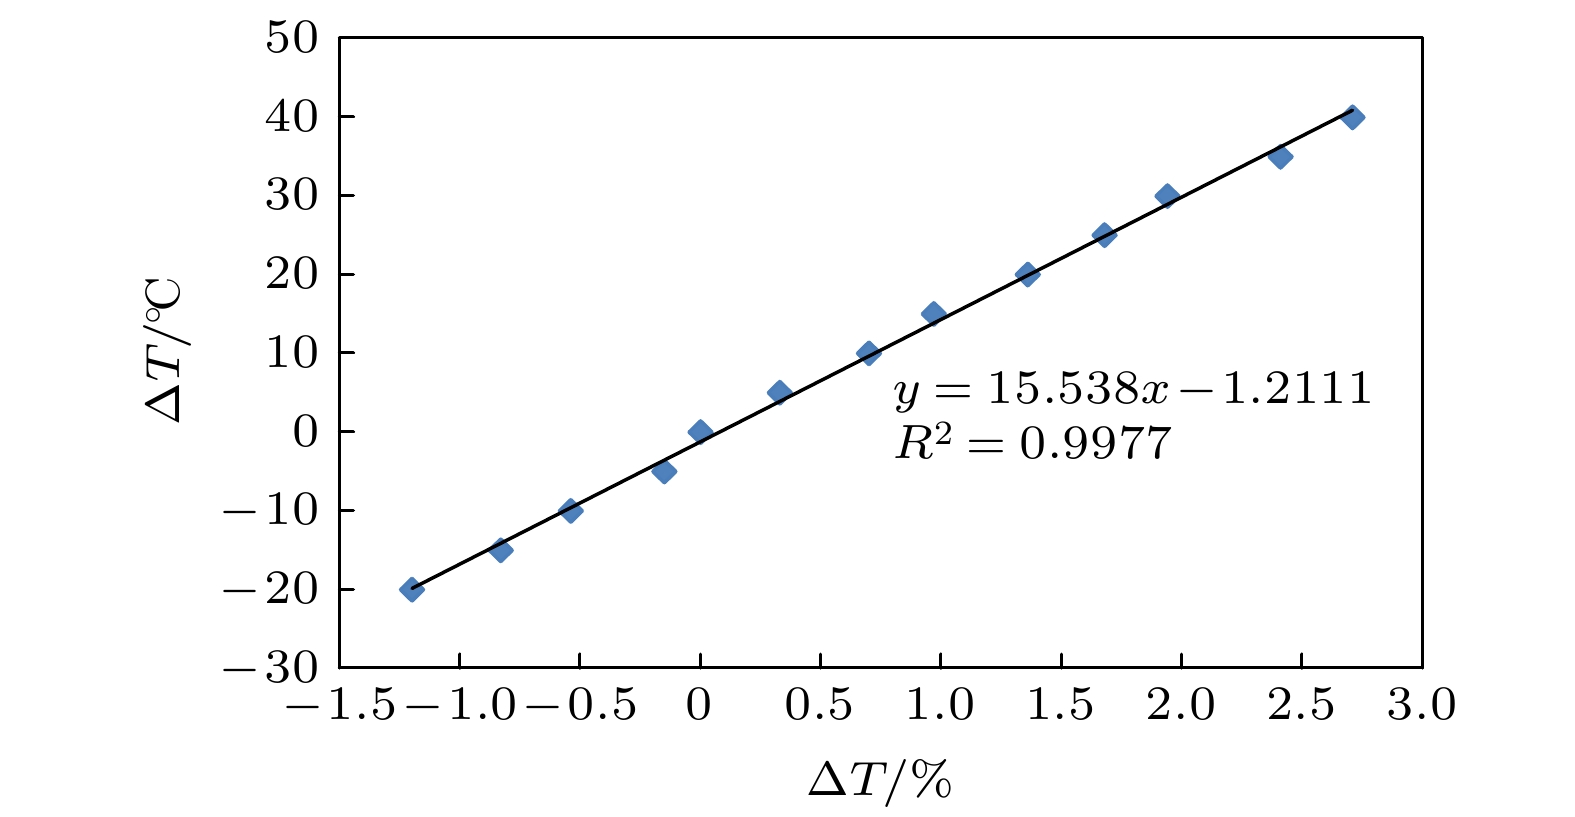 图 6 低色温LED定标函数曲线
Figure6. Calibration function curve of low color temperature LED.
采用 图2所示的基于光谱法的LED稳态热阻测量系统, 每隔一定时间采样光谱波谷处的归一化光谱强度, 待达到热平衡后便可通过敏感系数K和定标函数可以得出任意状态下的LED结温度, 同时测出正常工作时的输入电功率和发光光功率, 根据( 6)式便可得到此大功率低色温LED的稳态热阻.
为了验证采用本文的光谱法测定发光二极管稳态热阻的可行性, 还选取多种不同厂家的高低色温白光LED进行测试, 并与采用美国Mentor Graphics公司的T3Ster仪器运用正向压降法测出的热阻结果进行比较, 如 表4所列.
| LED种类 | 高色温LED(A) | 高色温LED(B) | 低色温LED(C) | 低色温LED(D) |
| 热耗散功率/W | 0.909 | 0.891 | 0.862 | 0.875 |
| 稳定时结温/℃ | 43.1 | 38.6 | 40.3 | 44.6 |
| 基板温度/℃ | 25.0 | 25.1 | 25.0 | 25.0 |
| 本文方法所得稳态热阻/(℃·W–1) | 19.9 | 15.2 | 17.7 | 22.3 |
| 采用T3Ster电压法测得稳态热阻/(℃·W–1) | 19.2 | 14.9 | 18.1 | 21.9 |
| 偏离度/% | 3.64 | 2.01 | –2.21 | 1.83 |
表4四种大功率白光LED稳态热阻测试结果
Table4.Steady state thermal resistance test results of four kinds of high power white LED.
通过 表4的稳定热阻数据可以看出, 采用本文的光谱法测得的白光LED稳态热阻结果与通过美国Mentor Graphics公司的T3Ster仪器采用正向压降法测得的结果的最大偏离度为3.64%, 偏差较小, 完全在可接受的范围内, 表明此方法的可行性.