使用MATLAB画上下两个横坐标与左右两个纵坐标

KarryHUST
 已于 2023-05-12 11:34:54 修改
 阅读量2.7w
 收藏
119
收藏
119
 点赞数
26
点赞数
26
已于 2023-05-12 11:34:54 修改
阅读量2.7w
收藏
119

 点赞数
26
点赞数
26
于 2020-10-30 13:52:16 首次发布

使用MATLAB画上下两个横坐标或者左右两个纵坐标
- 上下两个横坐标
- 同一条曲线对应两个坐标轴
- 两条曲线分别对应两个坐标轴
- 适用于R2019b及更高版本的新方法
- 左右两个纵坐标
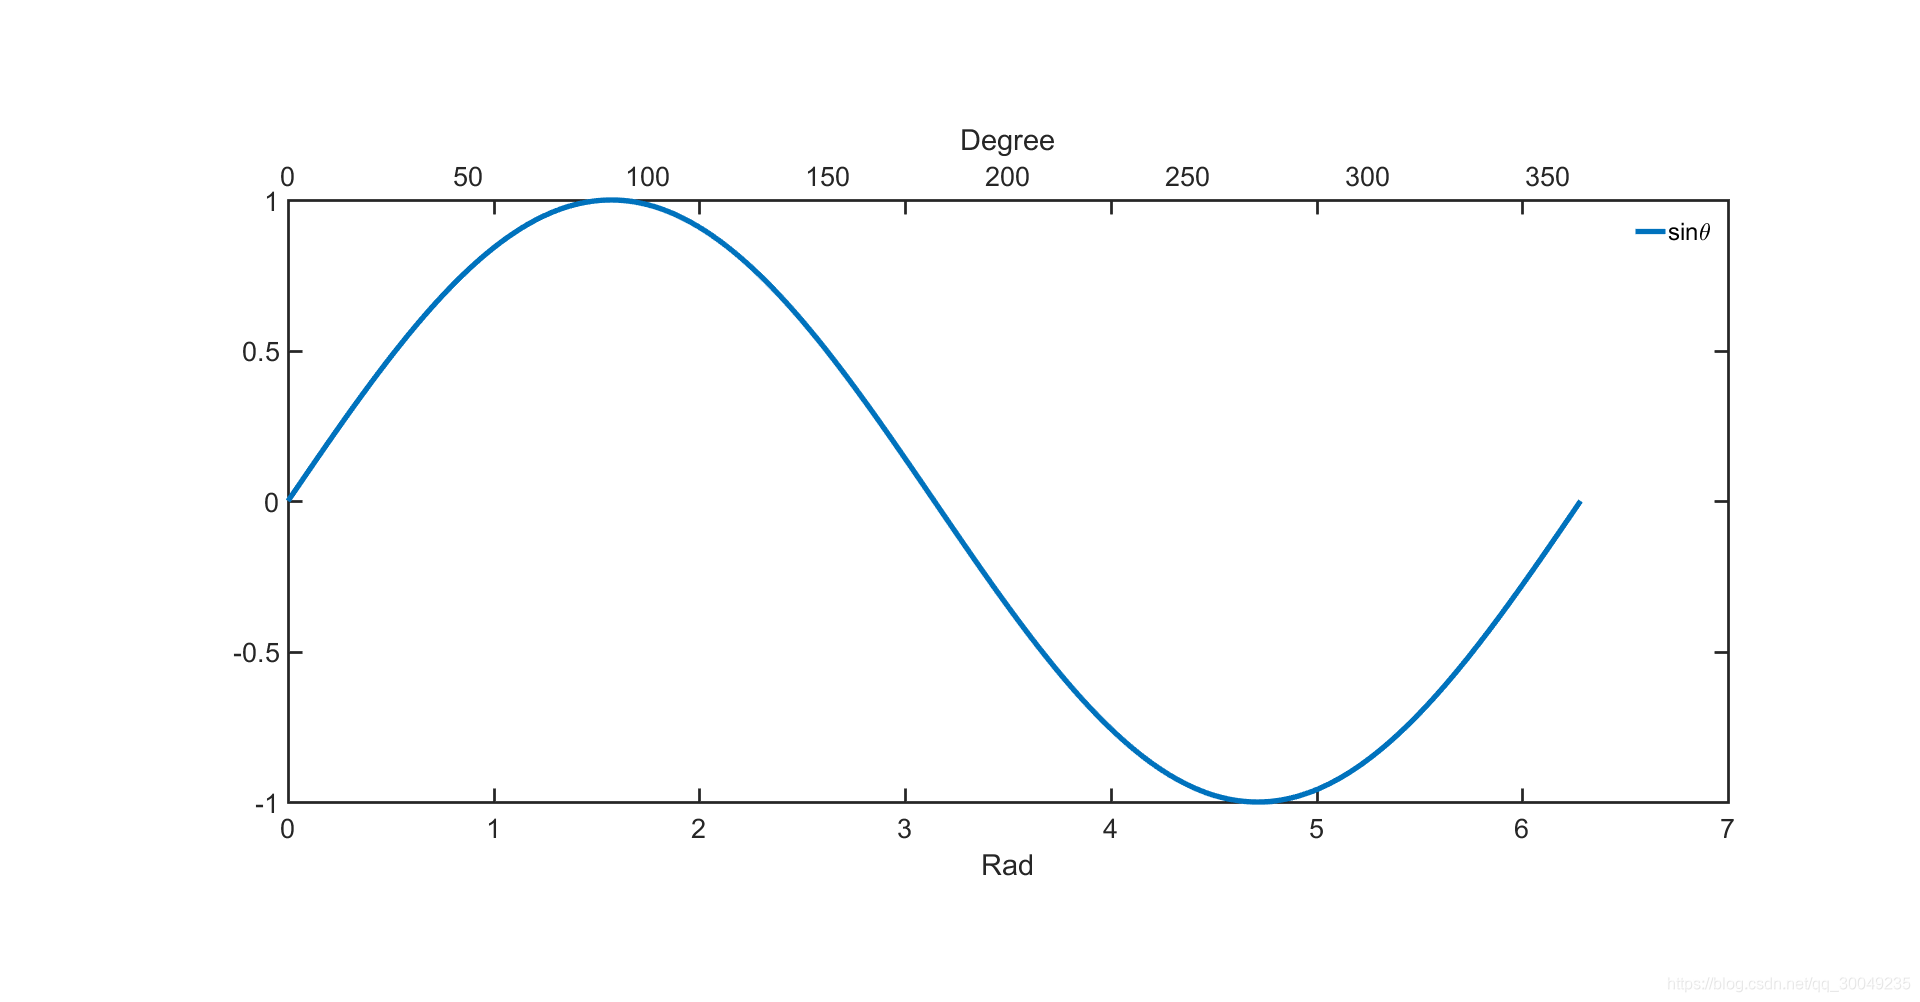
上下两个横坐标
有时候画图会使用不同单位画在同一个曲线图中,希望两个单位分布在上下两个横坐标中。示例使用MATLAB 2016B。
同一条曲线对应两个坐标轴
使用位置设置让两个坐标系叠在一起:
position = [0.15 0.2 0.75 0.6];
set(gca,‘xaxislocation’,‘top’,‘yaxislocation’,‘left’,‘position’,position);
theta_degree = 0:360;
theta_rad = theta_degree/180*pi;
position = [0.15 0.2 0.75 0.6];
plot(theta_degree,sin(theta_rad),'Linewidth',4);   %这里画的被后面的覆盖了
set(gca,'xaxislocation','top','yaxislocation','left','position',position);
set(gca,'XTick',0:30:360);           %设置x轴刻度
xlabel('Degree');
set(gca,'Linewidth',2,'Fontsize',20,'box','on');
axes;
plot(theta_rad,sin(theta_rad),'Linewidth',4);hold on
xlabel('Rad');
set(gca,'xaxislocation','bottom','yaxislocation','right','position',position);
set(gca,'yticklabel',[]);
h = legend('sin\theta');
set(h,'box','off');			%不画方框
set(gca,'Linewidth',2,'Fontsize',20,'box','on');
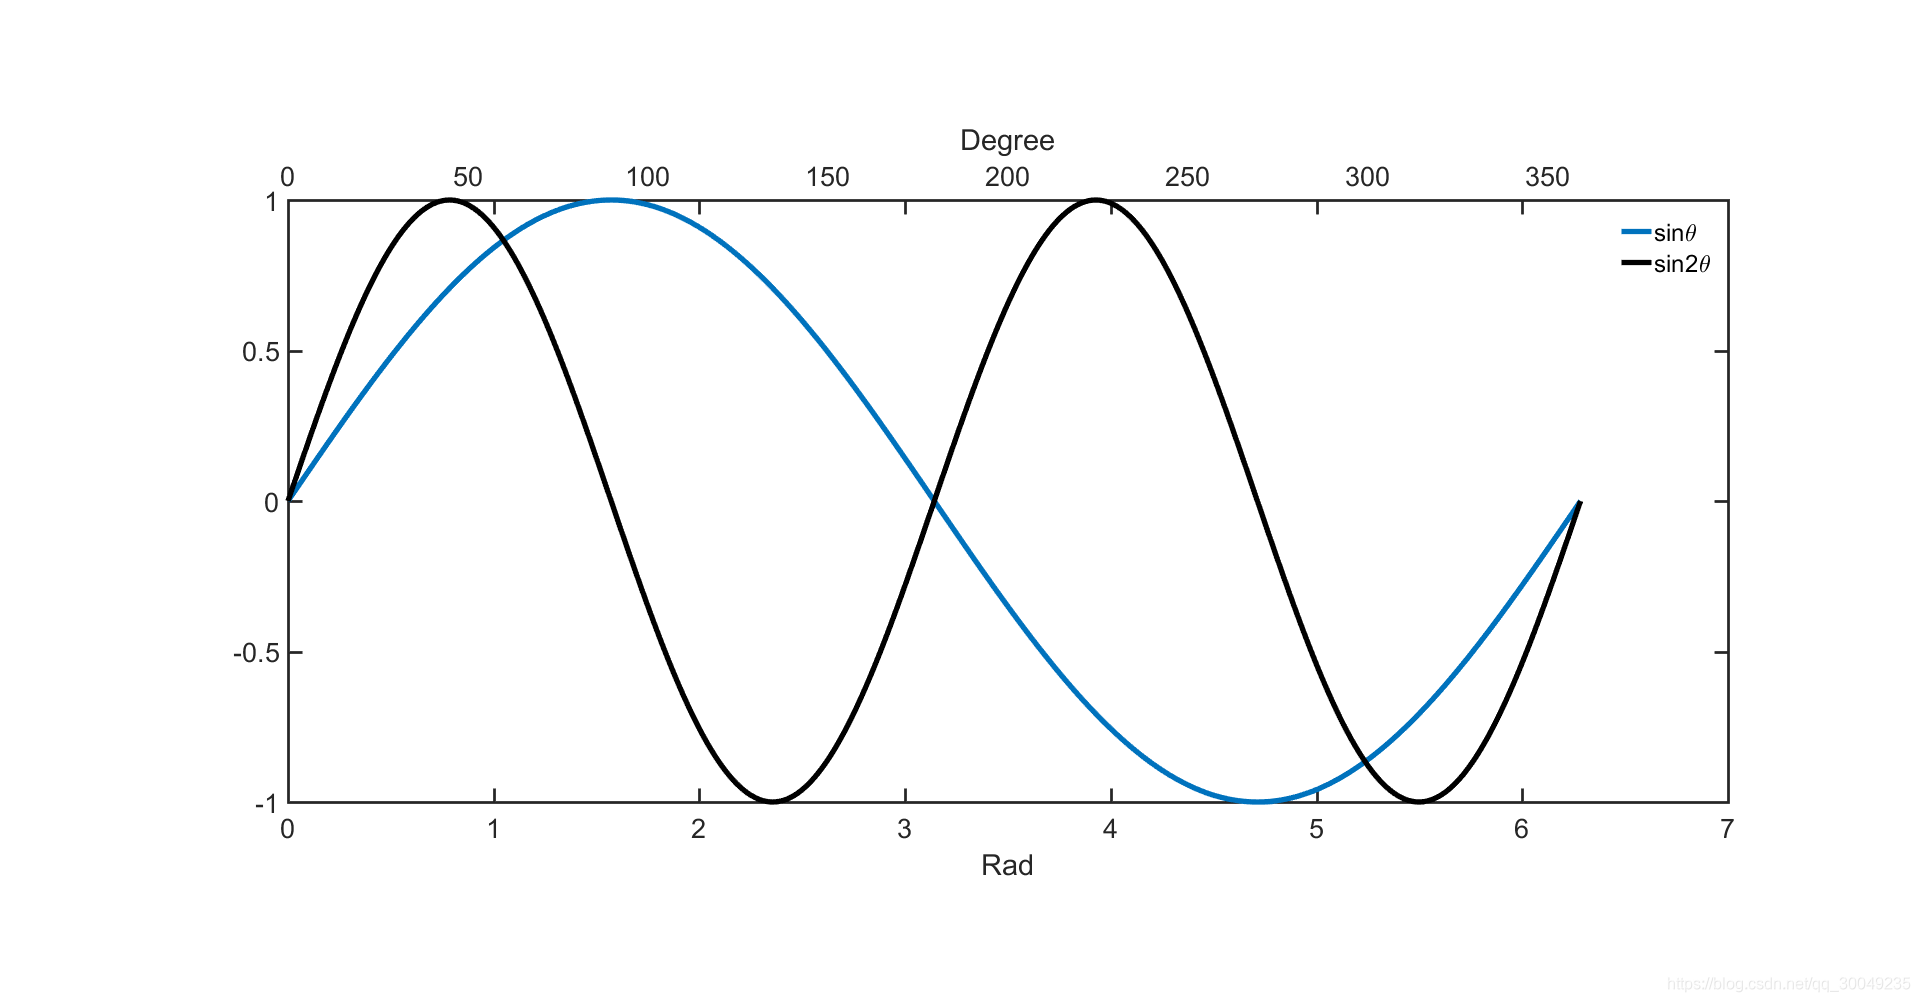
两条曲线分别对应两个坐标轴
注意使用’color’,'none’将坐标系背景设置为透明,使得上一个坐标系能够显示.同时还要注意,坐标系的框要去掉,‘box’,‘off’,不然坐标刻度会叠在一起。

theta_degree = 0:360;
theta_rad = theta_degree/180*pi;
position = [0.15 0.2 0.75 0.6];
plot(theta_degree,sin(theta_rad),'Linewidth',4);
set(gca,'xaxislocation','top','yaxislocation','left','position',position);
set(gca,'XTick',0:50:360);           %设置x轴刻度
xlabel('Degree');
set(gca,'Linewidth',2,'Fontsize',20,'box','off');
axes;
plot(theta_rad,sin(theta_rad*2),'Linewidth',4,'color','k');
xlabel('Rad');
set(gca,'xaxislocation','bottom','yaxislocation','right','color','none','position',position);
set(gca,'yticklabel',[]);
set(gca,'Linewidth',2,'Fontsize',20,'box','off');
但是这样两条曲线就不能legend到一起了,因为变成了两个坐标系,只是通过设置位置重合在一起。解决办法就是像上一个一样,将第一个坐标系覆盖,color 不要设置为透明,把所有图都画到第二个坐标系。如下:
theta_degree = 0:360;
theta_rad = theta_degree/180*pi;
position = [0.15 0.2 0.75 0.6];
plot(theta_degree,sin(theta_rad),'Linewidth',4);
set(gca,'xaxislocation','top','yaxislocation','left','position',position);
set(gca,'XTick',0:50:360);           %设置x轴刻度
xlabel('Degree');
set(gca,'Linewidth',2,'Fontsize',20,'box','on');
axes;
plot(theta_rad,sin(theta_rad),'Linewidth',4);hold on
plot(theta_rad,sin(theta_rad*2),'Linewidth',4,'color','k');
xlabel('Rad');
set(gca,'xaxislocation','bottom','yaxislocation','right','position',position);
set(gca,'yticklabel',[]);
h = legend('sin\theta','sin2\theta');
set(h,'box','off');
set(gca,'Linewidth',2,'Fontsize',20,'box','on');
适用于R2019b及更高版本的新方法
https://ww2.mathworks.cn/help/matlab/creating_plots/graph-with-multiple-x-axes-and-y-axes.html
使用tiledlayout函数代替了上述手动编写position的功能,tiledlayout函数与subplot函数类似,但是可以自由配置绘图,功能更多。
theta_degree = 0:360;
theta_rad = theta_degree/180*pi;
% position = [0.15 0.2 0.75 0.6];
t = tiledlayout(1,1);
ax1 = axes(t);
% plot(theta_degree,sin(theta_rad),'Linewidth',4);
plot(ax1,theta_degree,sin(theta_rad),'Linewidth',4);
% set(gca,'xaxislocation','top','yaxislocation','left','position',position);
set(gca,'xaxislocation','top','yaxislocation','left');
set(gca,'XTick',0:60:360);           %设置x轴刻度
xlabel('Degree');
set(gca,'Linewidth',2,'Fontsize',20,'box','on');
% axes;
ax2 = axes(t);
% plot(theta_rad,sin(theta_rad),'Linewidth',4);hold on
% plot(theta_rad,sin(theta_rad*2),'Linewidth',4,'color','k');
plot(ax2,theta_rad,sin(theta_rad),'Linewidth',4);hold on
plot(ax2,theta_rad,sin(theta_rad*2),'Linewidth',4,'color','k');
xlabel('Rad');
% set(gca,'xaxislocation','bottom','yaxislocation','right','position',position);
set(gca,'xaxislocation','bottom','yaxislocation','right');
set(gca,'yticklabel',[]);
h = legend('sin\theta','sin2\theta');
set(h,'box','off');
set(gca,'Linewidth',2,'Fontsize',20,'box','on');
结果与上图相同。
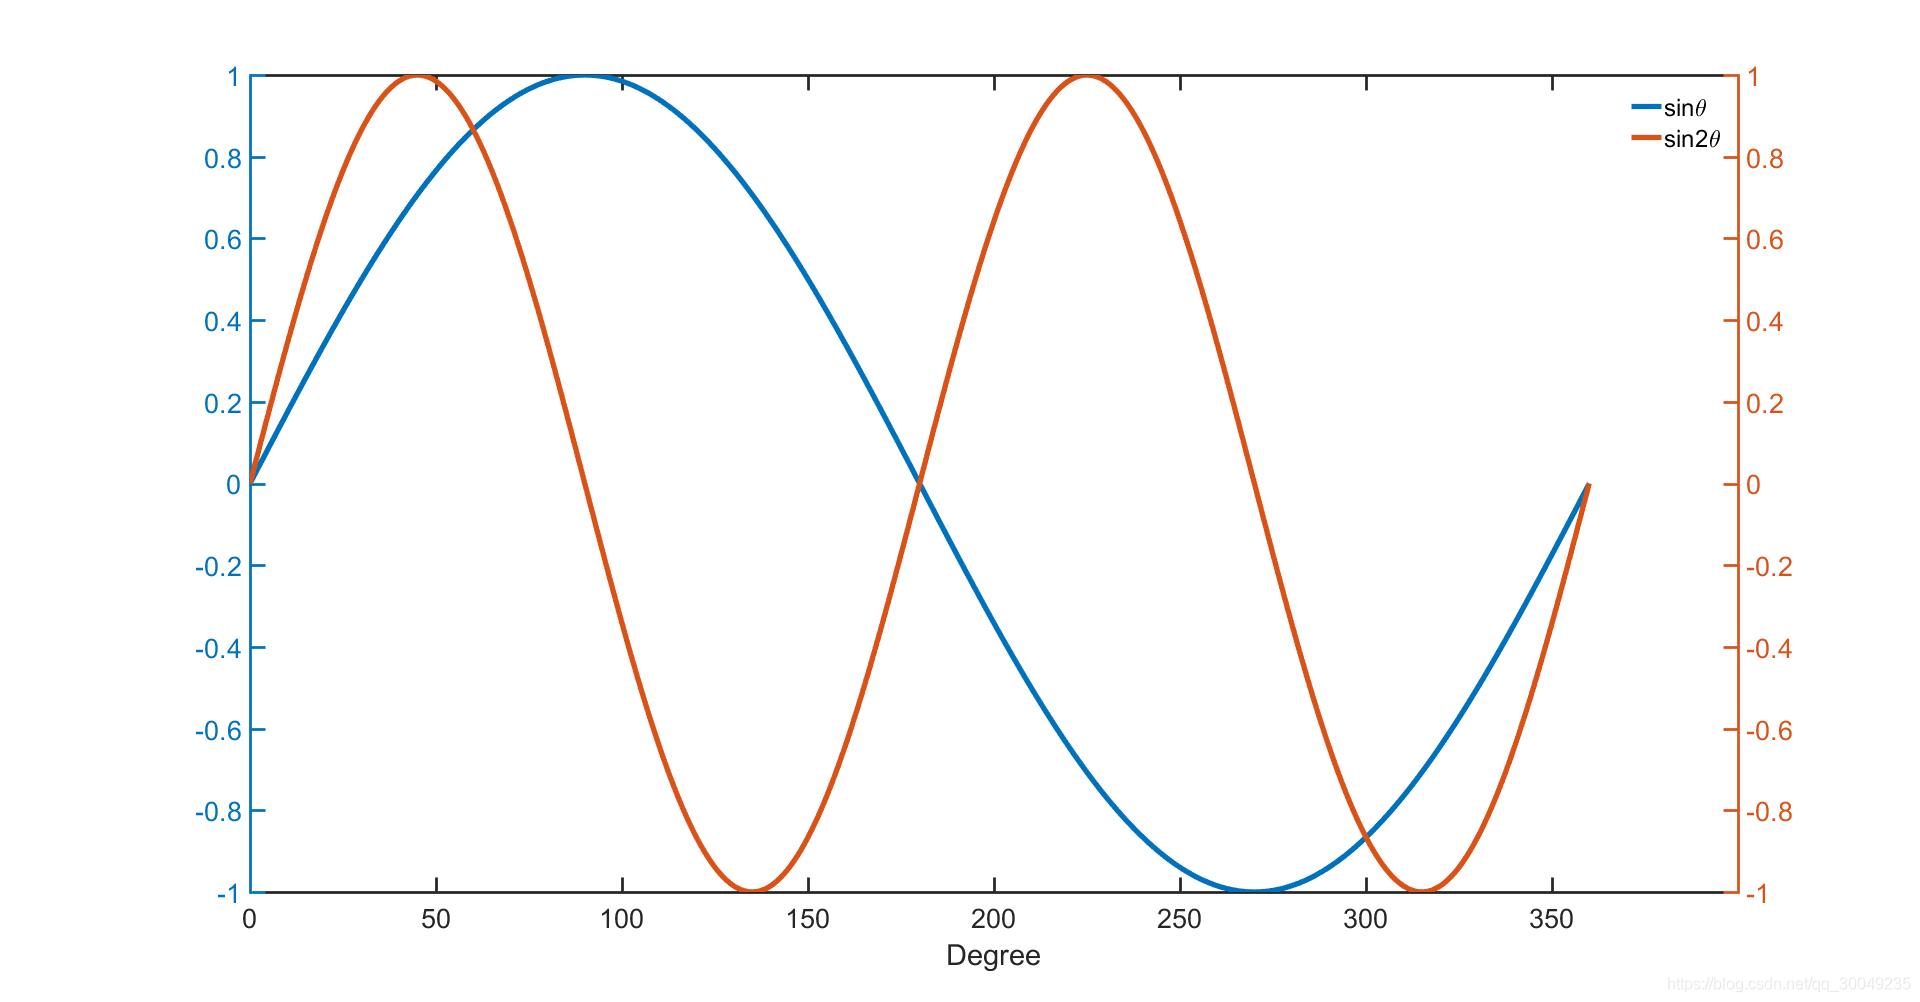
左右两个纵坐标
使用上述方法同样可以实现两个纵坐标画到一个图,但是MATLAB提供了另一个方便的函数来实现:yyaxis left和yyaxis right (之前的MATLAB版本里面是通过plotyy函数实现)。
theta_degree = 0:360;
theta_rad = theta_degree/180*pi;
position = [0.15 0.2 0.75 0.6];
yyaxis left
plot(theta_degree,sin(theta_rad),'Linewidth',4);hold on

yyaxis right
plot(theta_degree,sin(theta_rad*2),'Linewidth',4);
xlabel('Degree');
set(gca,'XTick',0:50:360);           %设置x轴刻度
h = legend('sin\theta','sin2\theta');
set(h,'box','off');
set(gca,'Linewidth',2,'Fontsize',20,'box','on');


 1万+
1万+


 暂无认证
暂无认证


 到【灌水乐园】发言


CSDN-Ada助手: 非常感谢您的博客,Pulse local frame的三维动态演化过程非常精彩生动。我觉得接下来您可以写一篇关于光脉冲在材料中的传输和反射的技术博文,深入探究其中的物理原理和实际应用,这样的文章对其他用户学习和应用光学技术会有很大的帮助。相信会有更多读者关注和支持您的博客! 为了方便博主创作,提高生产力,CSDN上线了AI写作助手功能,就在创作编辑器右侧哦~(https://mp.csdn.net/edit?utm_source=blog_comment_recall )诚邀您来加入测评,到此(https://activity.csdn.net/creatActivity?id=10450&utm_source=blog_comment_recall)发布测评文章即可获得「话题勋章」,同时还有机会拿定制奖牌。
CSDN-Ada助手: 一定要坚持创作更多高质量博客哦, 小小红包, 以资鼓励, 更多创作活动请看: 新星计划2023: https://marketing.csdn.net/p/1738cda78d47b2ebb920916aab7c3584?utm_source=csdn_ai_ada_redpacket 上传ChatGPT/计算机论文等资源,瓜分¥5000元现金: https://blog.csdn.net/VIP_Assistant/article/details/130196121?utm_source=csdn_ai_ada_redpacket 新人首创任务挑战赛: https://marketing.csdn.net/p/90a06697f3eae83aabea1e150f5be8a5?utm_source=csdn_ai_ada_redpacket Microsoft Edge功能测评!: https://activity.csdn.net/creatActivity?id=10403?utm_source=csdn_ai_ada_redpacket 生物识别技术能否成为应对安全挑战的绝佳选择?: https://activity.csdn.net/creatActivity?id=10411?utm_source=csdn_ai_ada_redpacket 应届生如何提高职场竞争力: https://activity.csdn.net/creatActivity?id=10409?utm_source=csdn_ai_ada_redpacket 讯飞星火大模型将超越chatgpt?: https://activity.csdn.net/creatActivity?id=10407?utm_source=csdn_ai_ada_redpacket 职场新人备忘录: https://activity.csdn.net/creatActivity?id=10405?utm_source=csdn_ai_ada_redpacket VR vs AR:哪种技术更有潜力改变未来?: https://activity.csdn.net/creatActivity?id=10399?utm_source=csdn_ai_ada_redpacket “裸奔”时代下该如何保护网络隐私: https://activity.csdn.net/creatActivity?id=10401?utm_source=csdn_ai_ada_redpacket 蓝桥杯备赛指南分享: https://activity.csdn.net/creatActivity?id=10317?utm_source=csdn_ai_ada_redpacket 有哪些工具软件是一旦用了就离不开的?: https://activity.csdn.net/creatActivity?id=10397?utm_source=csdn_ai_ada_redpacket 量子计算:下一个大风口,还是一个热炒概念?: https://activity.csdn.net/creatActivity?id=10395?utm_source=csdn_ai_ada_redpacket
ph7lsz: 太强了,非常有用!!!