JDK 自带 JVM 分析工具详解

 已于 2022-07-12 16:20:29 修改
 阅读量1.4k
 收藏
1
收藏
1


 点赞数
点赞数

本文基于 JDK 中自带的 JVM 工具来讲解,内容有
- JDK 自带哪些 JVM 分析工具
- 每个工具的具体使用场景
目录
- JDK 中自带的工具
- 使用技巧
- 各工具使用场景
- jps
- jinfo
- jmap
- jstack
- jhat
- jstat
JDK 中自带的工具
目前,针对 Java 应用在运行过程中出现的大部分 JVM 问题(如 OOM,FGC 等),我们都可通过 JDK 中自带的一些工具来分析解决。JDK 自带的工具可在 JDK 的安装目录的 bin 文件夹下找到。见图 1。
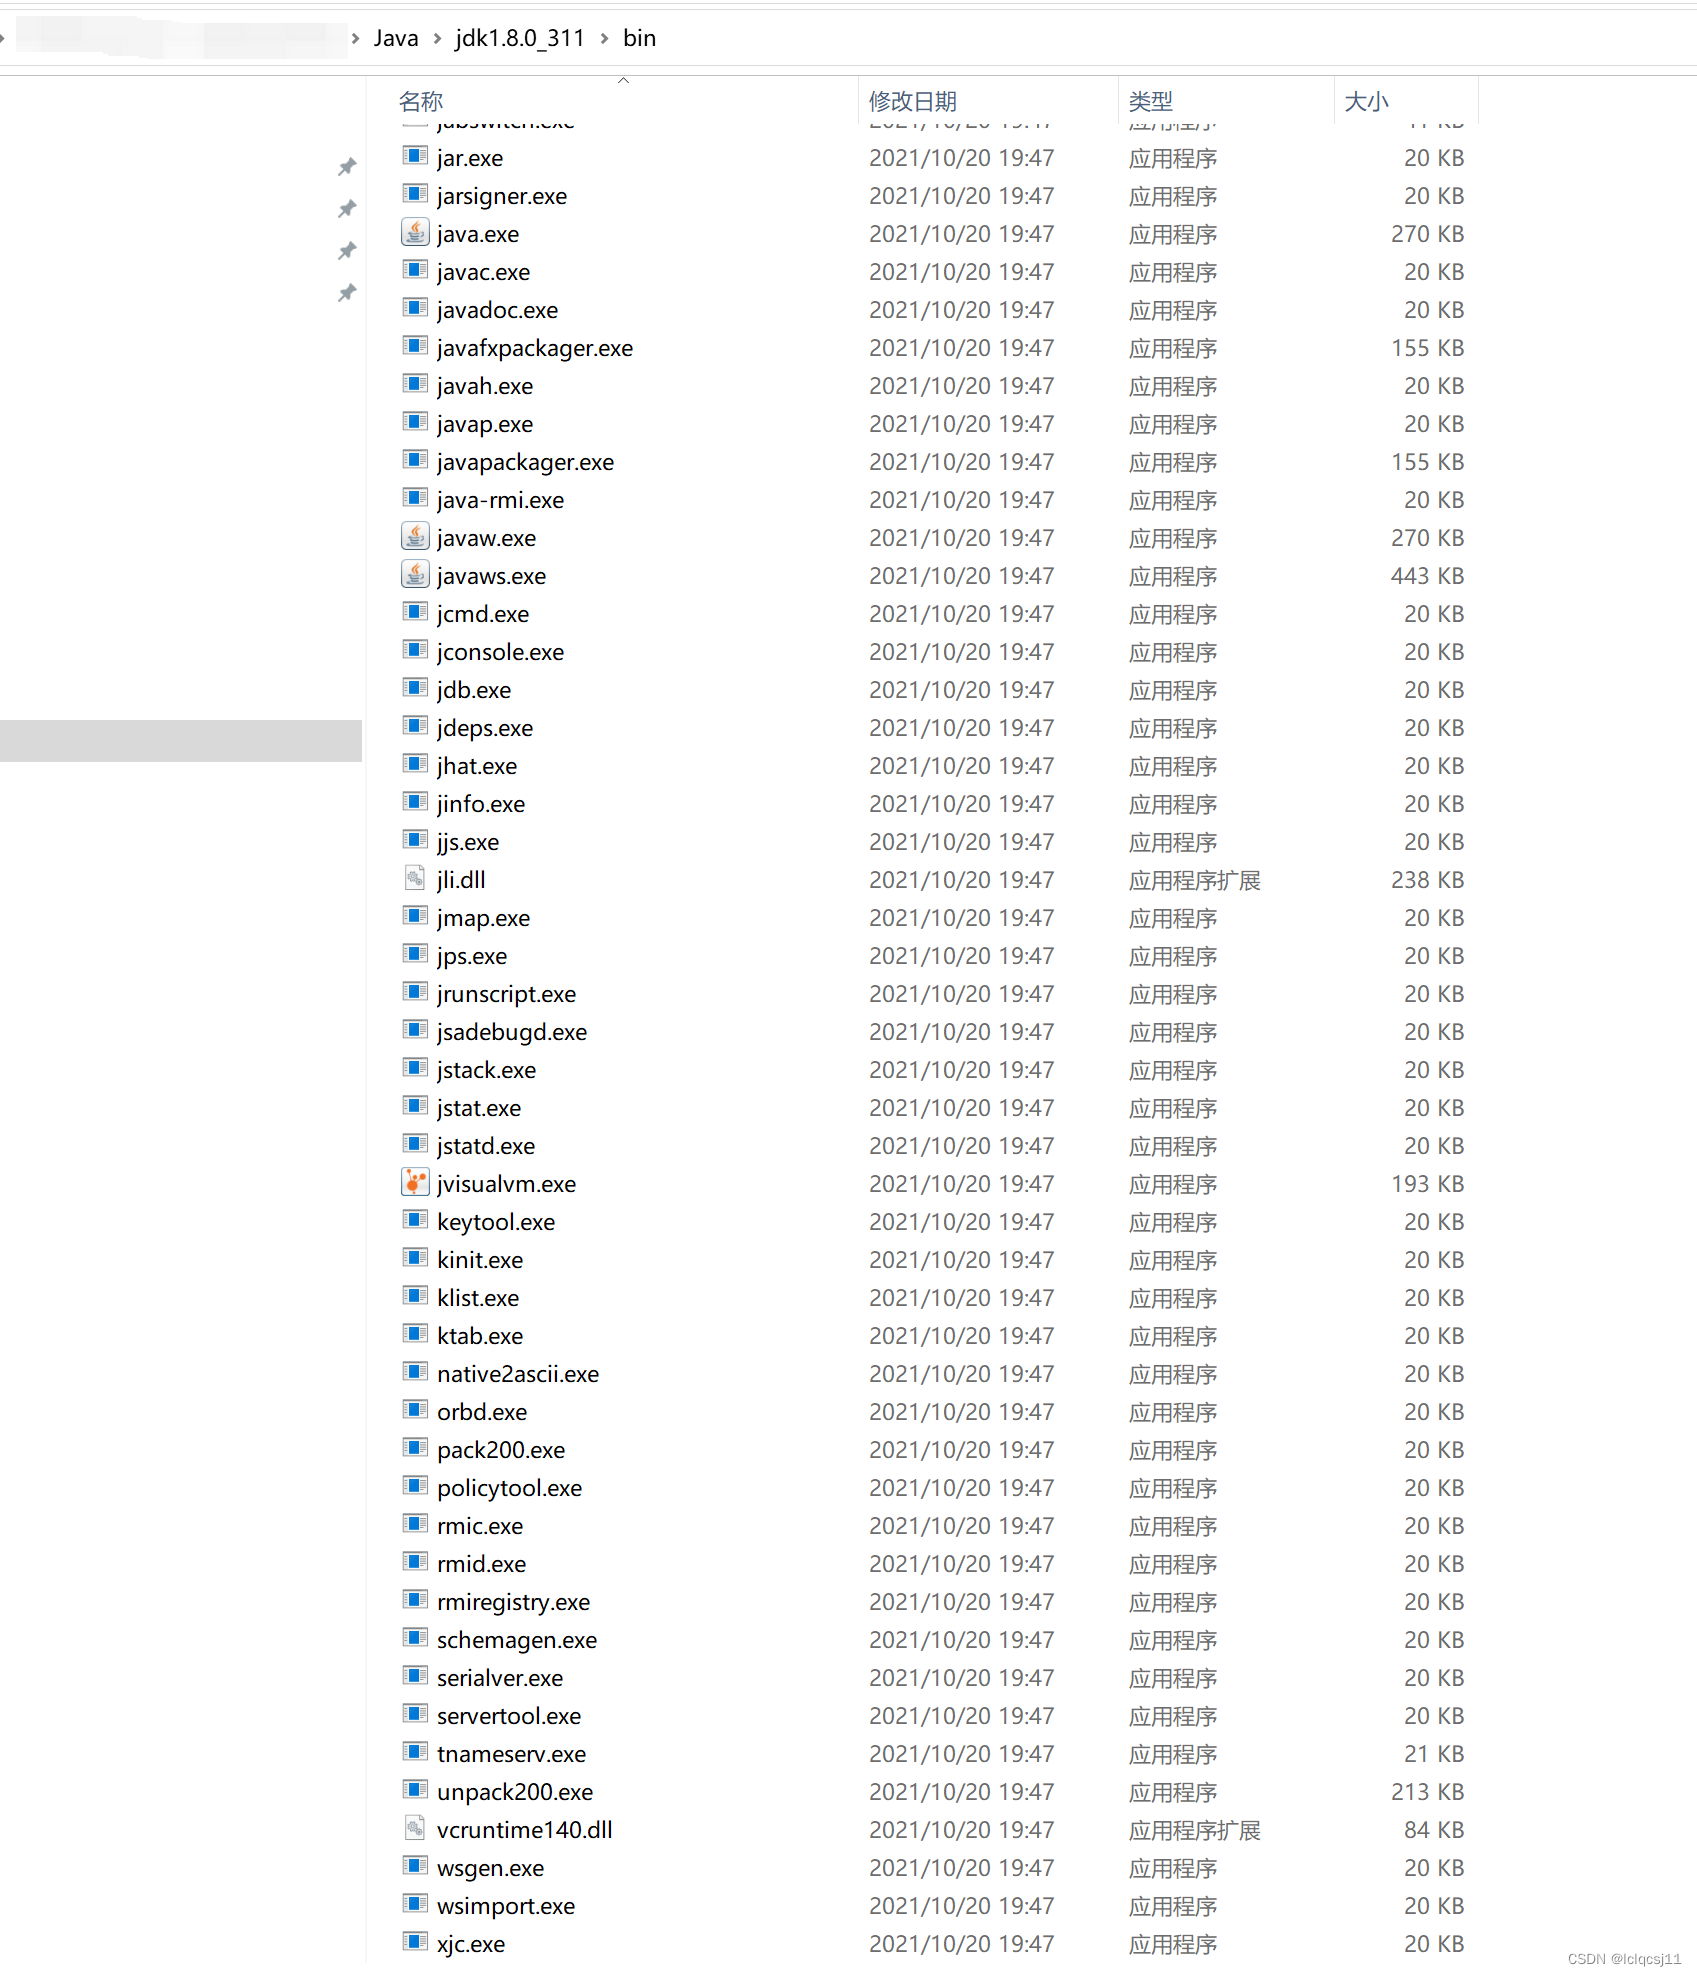
在图 1 众多的命令中,几个常用命令需特别熟悉
- jps
- jinfo
- jstack
- jmap
- jstat
- jhat
以及不是 jdk 自带的 VisualVM。每个命令具体使用见下文。
使用技巧
每个工具都设置了若干选项,用于查看不同层面的信息,若不清楚每个工具应该配置什么参数,可通过
> cmd -help
来查看命令的使用方式,如查看 jps 使用方式。
> jps -help
usage: jps [-help]
       jps [-q] [-mlvV] [<hostid>]

Definitions:
    <hostid>:      <hostname>[:<port>]
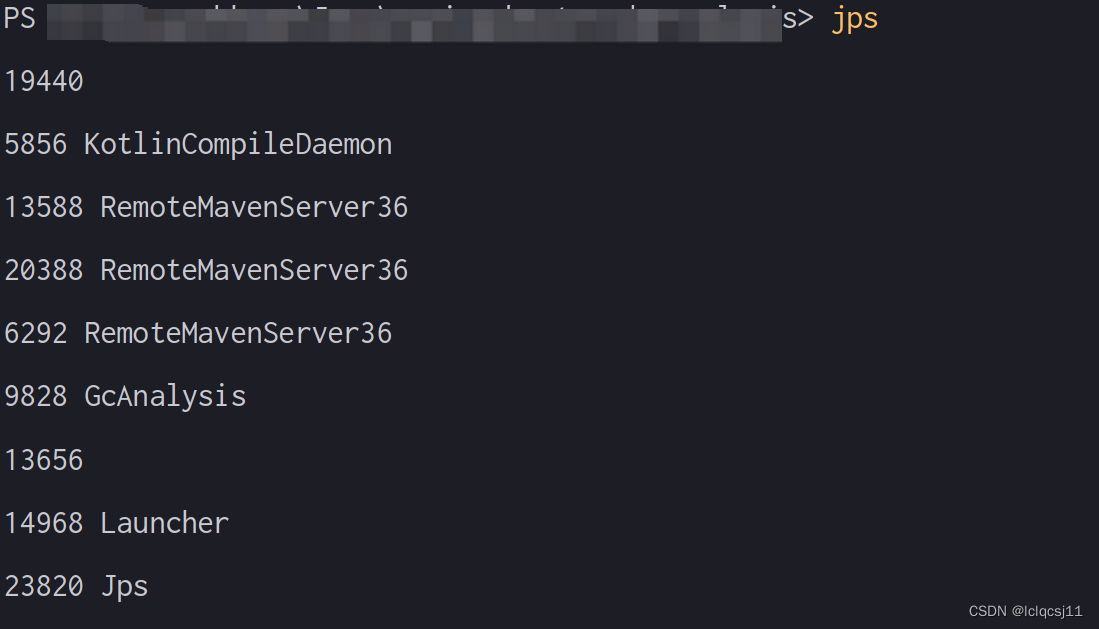
当使用 jps 不带任何可选参数时,将返回 pid(进程号)及进程名称。
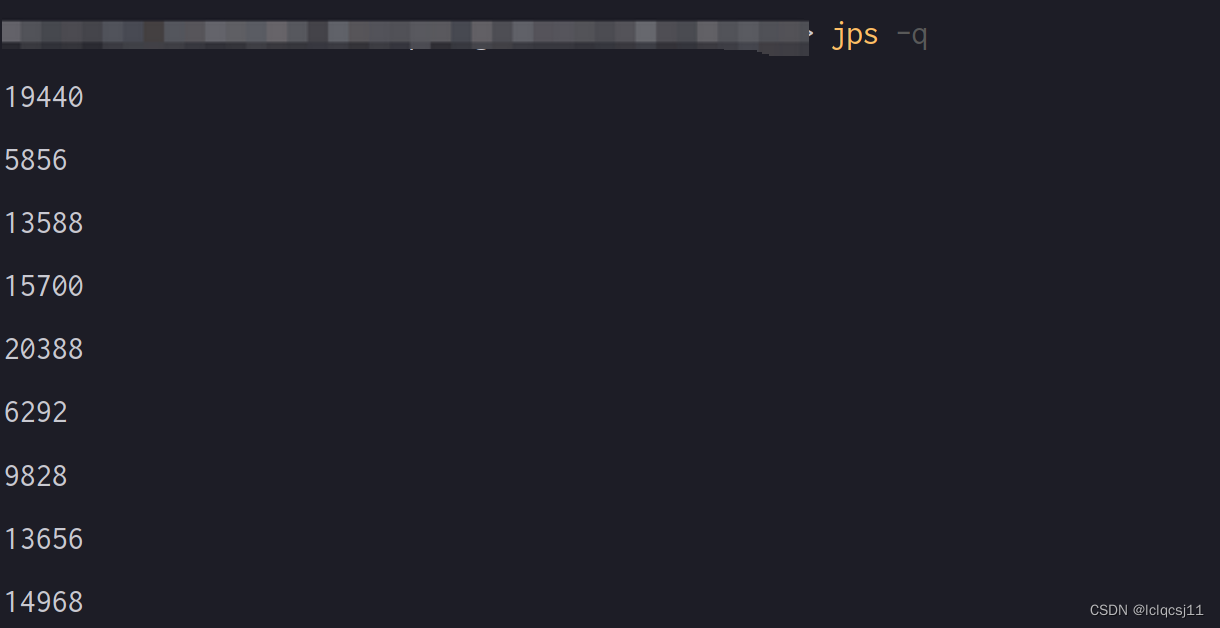
当仅使用 -q 参数时,将只返回 pid。
各工具使用场景
jps
jps 用于查看当前 JVM 上运行的 Java 进程。使用过 Linux 的同学都知道,Linux 系统下有一个 ps 命令,用于列出系统的所有进程,可配合不同的参数选项,查看不同层面的信息。jps 具体的使用方式可见图 2、图 3,此处不累述。
jinfo
jinfo 全称 Java Configuration info 可用于查看或设置(部分可动态配置的)
- 具体的 pid 信息
- 可执行文件信息
- 远程服务信息
其使用方式如下
> jinfo -help
Usage:
    jinfo [option] <pid>
        (to connect to running process)
    jinfo [option] <executable <core>
        (to connect to a core file)
    jinfo [option] [server_id@]<remote server IP or hostname>
        (to connect to remote debug server)

where <option> is one of:
    -flag <name>         to print the value of the named VM flag
    -flag [+|-]<name>    to enable or disable the named VM flag
    -flag <name>=<value> to set the named VM flag to the given value
    -flags               to print VM flags
    -sysprops            to print Java system properties
    <no option>          to print both of the above
    -h | -help           to print this help message
在这里,我们仅需知道 如何使用 jinfo 查看指定 pid 的信息 即可。
使用方式有以下三种
-
仅使用 -flag(s) 可选参数
使用 -flags 查看所有 VM 参数信息> jinfo -flags pid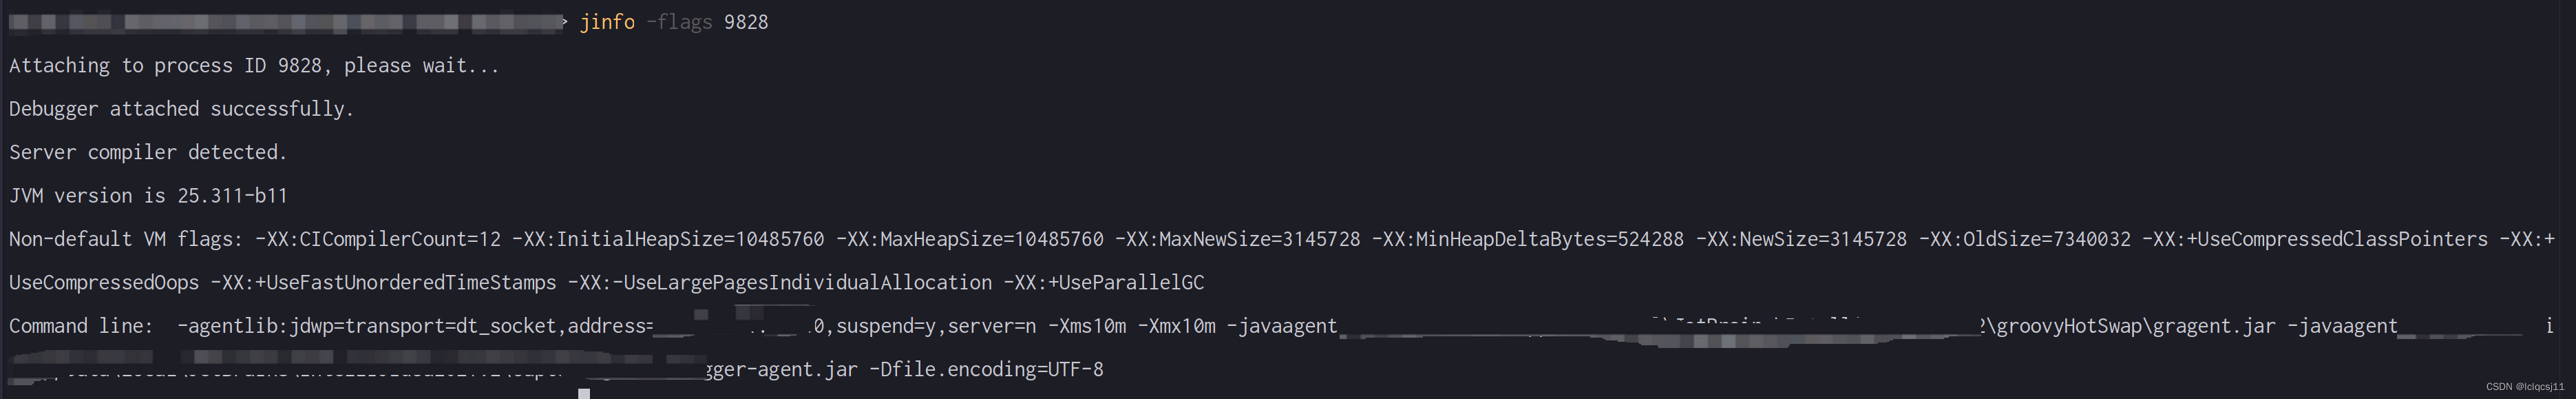
图 4 或使用 -flag name 查看指定 name 的参数信息。(其实使用 -flags 已经可查看所有的 VM 参数,个人觉得没有特别大的必要使用 -flag 那么 查看单个 VM 参数信息)。
> jinfo -flag name pid -
仅使用 -sysprops 可选参数
使用 -sysprops 参数查看系统信息,系统信息较多,这里不展示结果,感兴趣的同学可以自己在命令行输入下述命令查看。> jinfo -sysprops pid -
不使用任何可选参数
> jinfo pid不使用任何参数查看进程信息时,将返回 -flags 和 -sysprops 两个参数的全部信息。
从图 4 可知,使用 jinfo 可查看到的 VM 参数信息有
- 初始堆大小 InitialHeapSize
- 最大堆大小 MaxHeapSize
- 最大新生代大小 MaxNewSize
- 老年代大小 OldSize
- 垃圾回收算法 +UseParallelGC
jmap
jmap 用于查看指定 pid 进程内存相关的信息。与 jinfo 类似,我们仅关注与具体进程相关的信息,不关注具体文件或远程服务的信息。
> jmap -help
Usage:
    jmap [option] <pid>
        (to connect to running process)
    jmap [option] <executable <core>
        (to connect to a core file)
    jmap [option] [server_id@]<remote server IP or hostname>
        (to connect to remote debug server)

where <option> is one of:
    <none>               to print same info as Solaris pmap
    -heap                to print java heap summary
    -histo[:live]        to print histogram of java object heap; if the "live"
                         suboption is specified, only count live objects
    -clstats             to print class loader statistics
    -finalizerinfo       to print information on objects awaiting finalization
    -dump:<dump-options> to dump java heap in hprof binary format
                         dump-options:
                           live         dump only live objects; if not specified,
                                        all objects in the heap are dumped.
                           format=b     binary format
                           file=<file>  dump heap to <file>
                         Example: jmap -dump:live,format=b,file=heap.bin <pid>
    -F                   force. Use with -dump:<dump-options> <pid> or -histo
                         to force a heap dump or histogram when <pid> does not
                         respond. The "live" suboption is not supported
                         in this mode.
    -h | -help           to print this help message
    -J<flag>             to pass <flag> directly to the runtime system
当使用命令
> jmap -heap pid
查看指定进程 id 内存信息时,将输出当前进程的堆内存概览,新生代、老年代的使用情况以及垃圾回收算法。如
> jmap -heap 2060
Attaching to process ID 2060, please wait...
Debugger attached successfully.
Server compiler detected.
JVM version is 25.311-b11

using thread-local object allocation.
Parallel GC with 13 thread(s)     // 垃圾回收算法

Heap Configuration:    // 堆配置总览
   MinHeapFreeRatio         = 0
   MaxHeapFreeRatio         = 100
   MaxHeapSize              = 10485760 (10.0MB)   // 堆大小
   NewSize                  = 3145728 (3.0MB)   // 新生代大小
   MaxNewSize               = 3145728 (3.0MB)    // 新生代最大值
   OldSize                  = 7340032 (7.0MB)   // 老年代大小
   NewRatio                 = 2
   SurvivorRatio            = 8
   MetaspaceSize            = 21807104 (20.796875MB)
   CompressedClassSpaceSize = 1073741824 (1024.0MB)
   MaxMetaspaceSize         = 17592186044415 MB
   G1HeapRegionSize         = 0 (0.0MB)

Heap Usage:  // 堆使用明细
PS Young Generation
Eden Space:
   capacity = 2097152 (2.0MB)
   used     = 1416072 (1.3504714965820312MB)
   free     = 681080 (0.6495285034179688MB)
   67.52357482910156% used
From Space:
   capacity = 524288 (0.5MB)
   used     = 516112 (0.4922027587890625MB)
   free     = 8176 (0.0077972412109375MB)
   98.4405517578125% used
To Space:
   capacity = 524288 (0.5MB)
   used     = 0 (0.0MB)
   free     = 524288 (0.5MB)
   0.0% used
PS Old Generation
   capacity = 7340032 (7.0MB)
   used     = 391312 (0.3731842041015625MB)
   free     = 6948720 (6.6268157958984375MB)
   5.331202915736607% used
若想看指定进程 id 下有多少对象正在等待被回收,可使用命令
> jmap -finalizerinfo pid
如当前进程无正在等待被回收对象时,将输出
> jmap -finalizerinfo 3932
Attaching to process ID 3932, please wait...
Debugger attached successfully.
Server compiler detected.
JVM version is 25.311-b11
Number of objects pending for finalization: 0
使用 -histo[:live] 可查看每个 class 的实例数目,内存使用情以及类全名信息。如在 -histo 后加上 live 子参数,将只统计活的对象数量(即在统计之前会触发一次 Full GC)。如
> jmap -histo -F 3932
Attaching to process ID 3932, please wait...
Debugger attached successfully.
Server compiler detected.
JVM version is 25.311-b11
Iterating over heap. This may take a while...
Object Histogram:

num       #instances    #bytes  Class description
--------------------------------------------------------------------------
1:              1441    1092752 byte[]
2:              5234    684472  char[]
3:              243     121520  int[]
4:              4251    102024  java.lang.String
5:              565     64944   java.lang.Class
6:              669     40048   java.lang.Object[]
7:              791     31640   java.util.TreeMap$Entry
...
// 以下还有很多,此处仅做 case 说明,未给出所有 class 的实例数量及相关信息
注意!!!
遍历堆并生成直方图的过程中,目标 JVM 都是 stop-the-world 的,所以对于较大的堆或者生产环境上的程序,要谨慎执行。如果目标 JVM 无响应,就加上 -F 参数强制执行之(同 jstack),此时 :live 开关无效化
若想把整个堆转存为快照文件,可使用 -dump 参数,如
> jmap -F -dump:file=3932.hprof 23308
Attaching to process ID 23308, please wait...
Debugger attached successfully.
Server compiler detected.
JVM version is 25.311-b11
Dumping heap to 3932.hprof ...
Heap dump file created
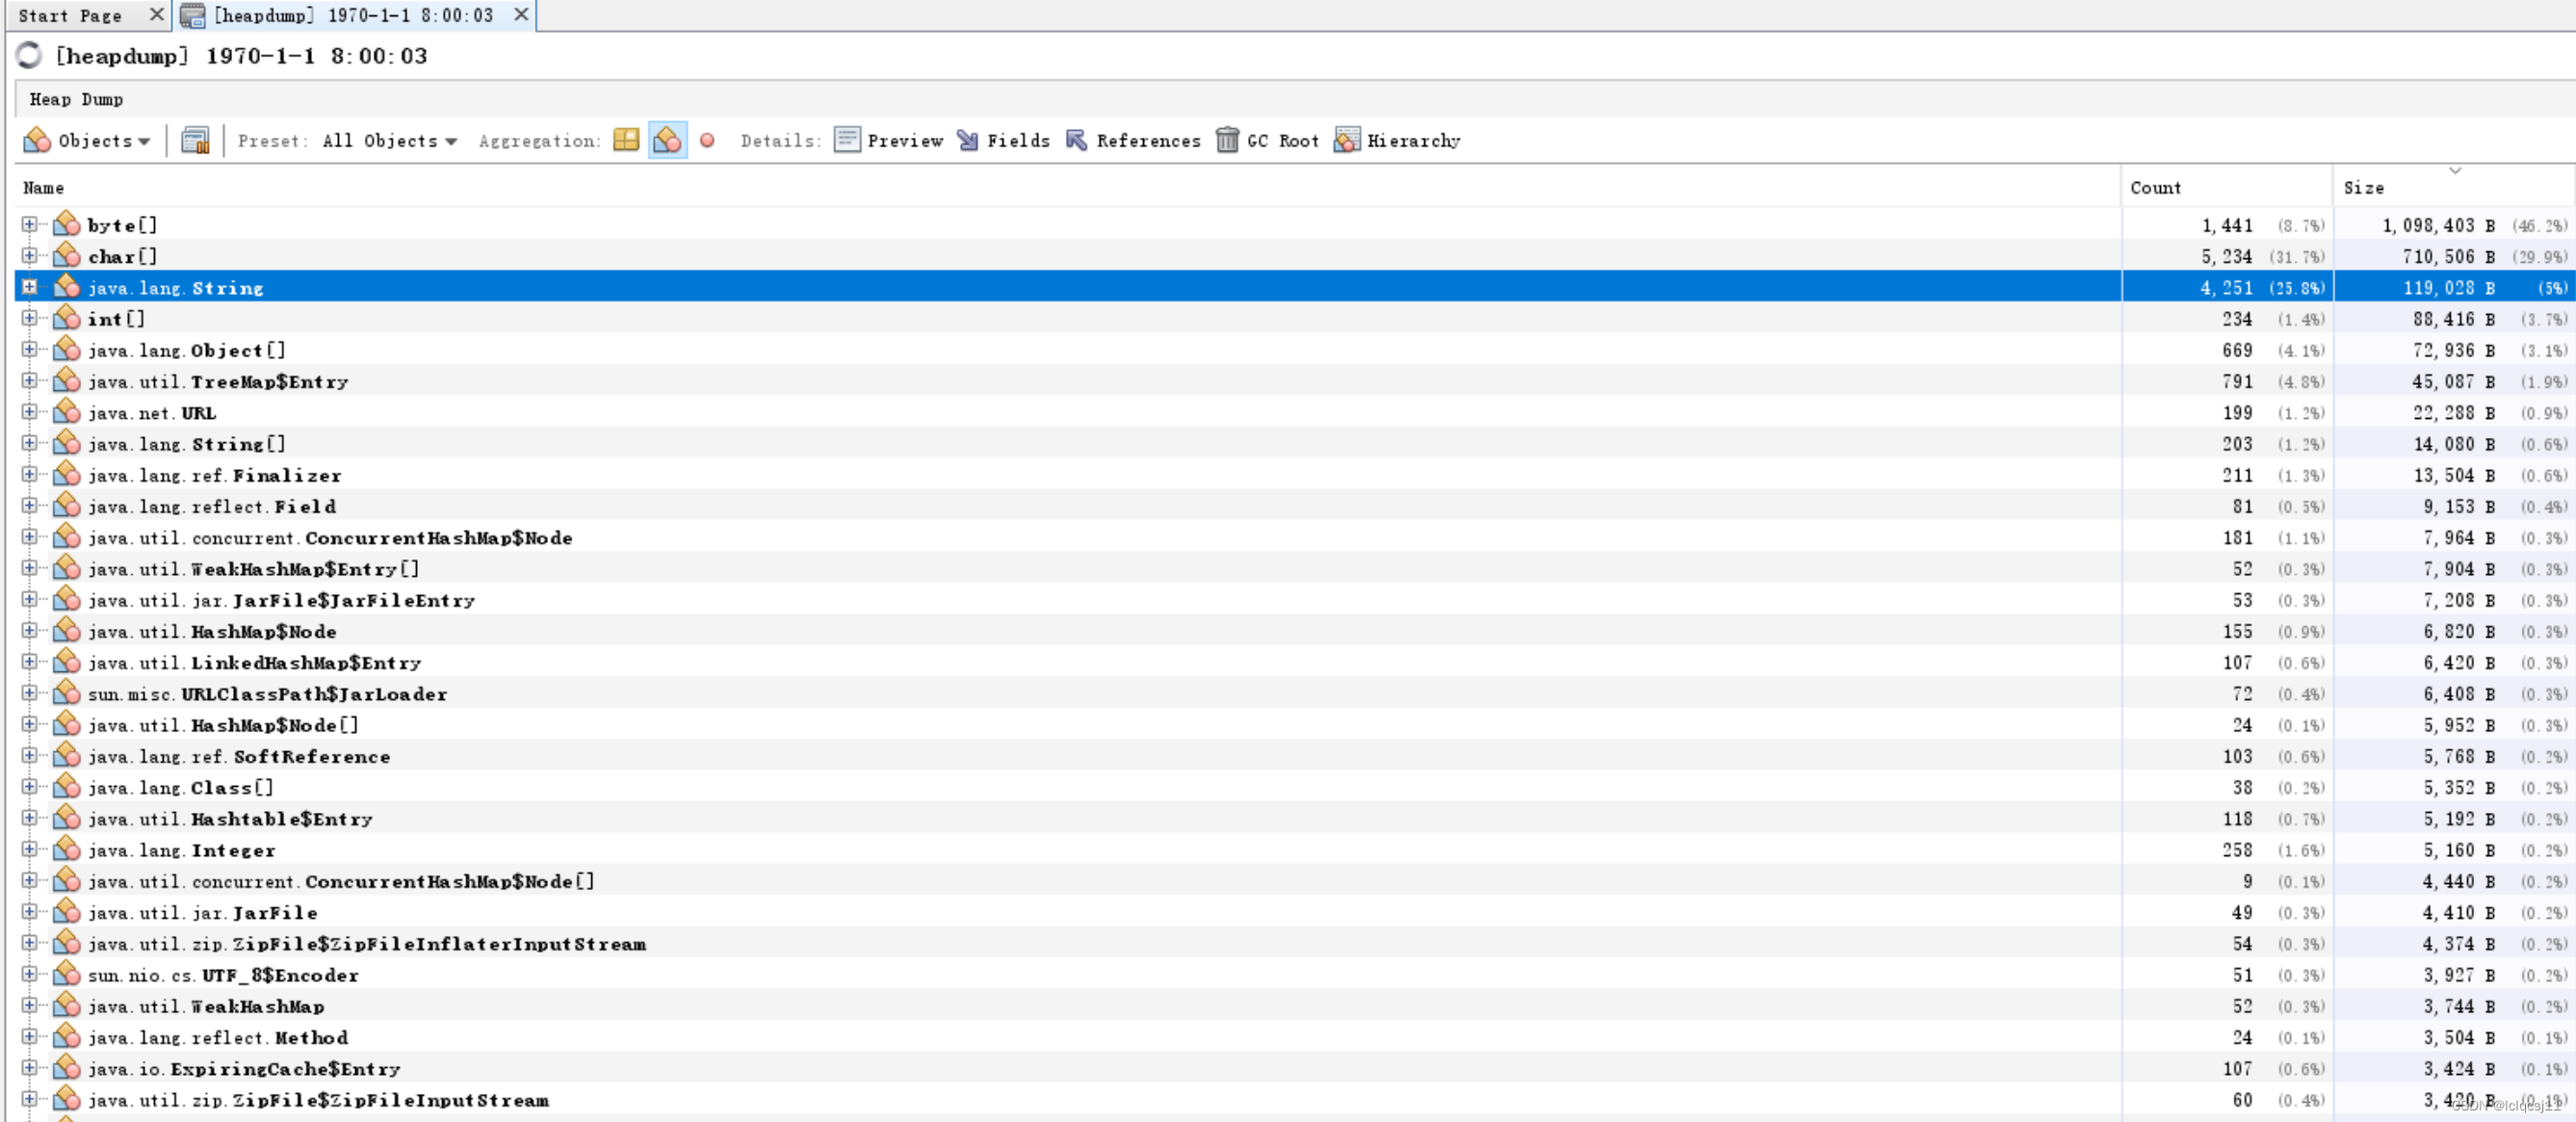
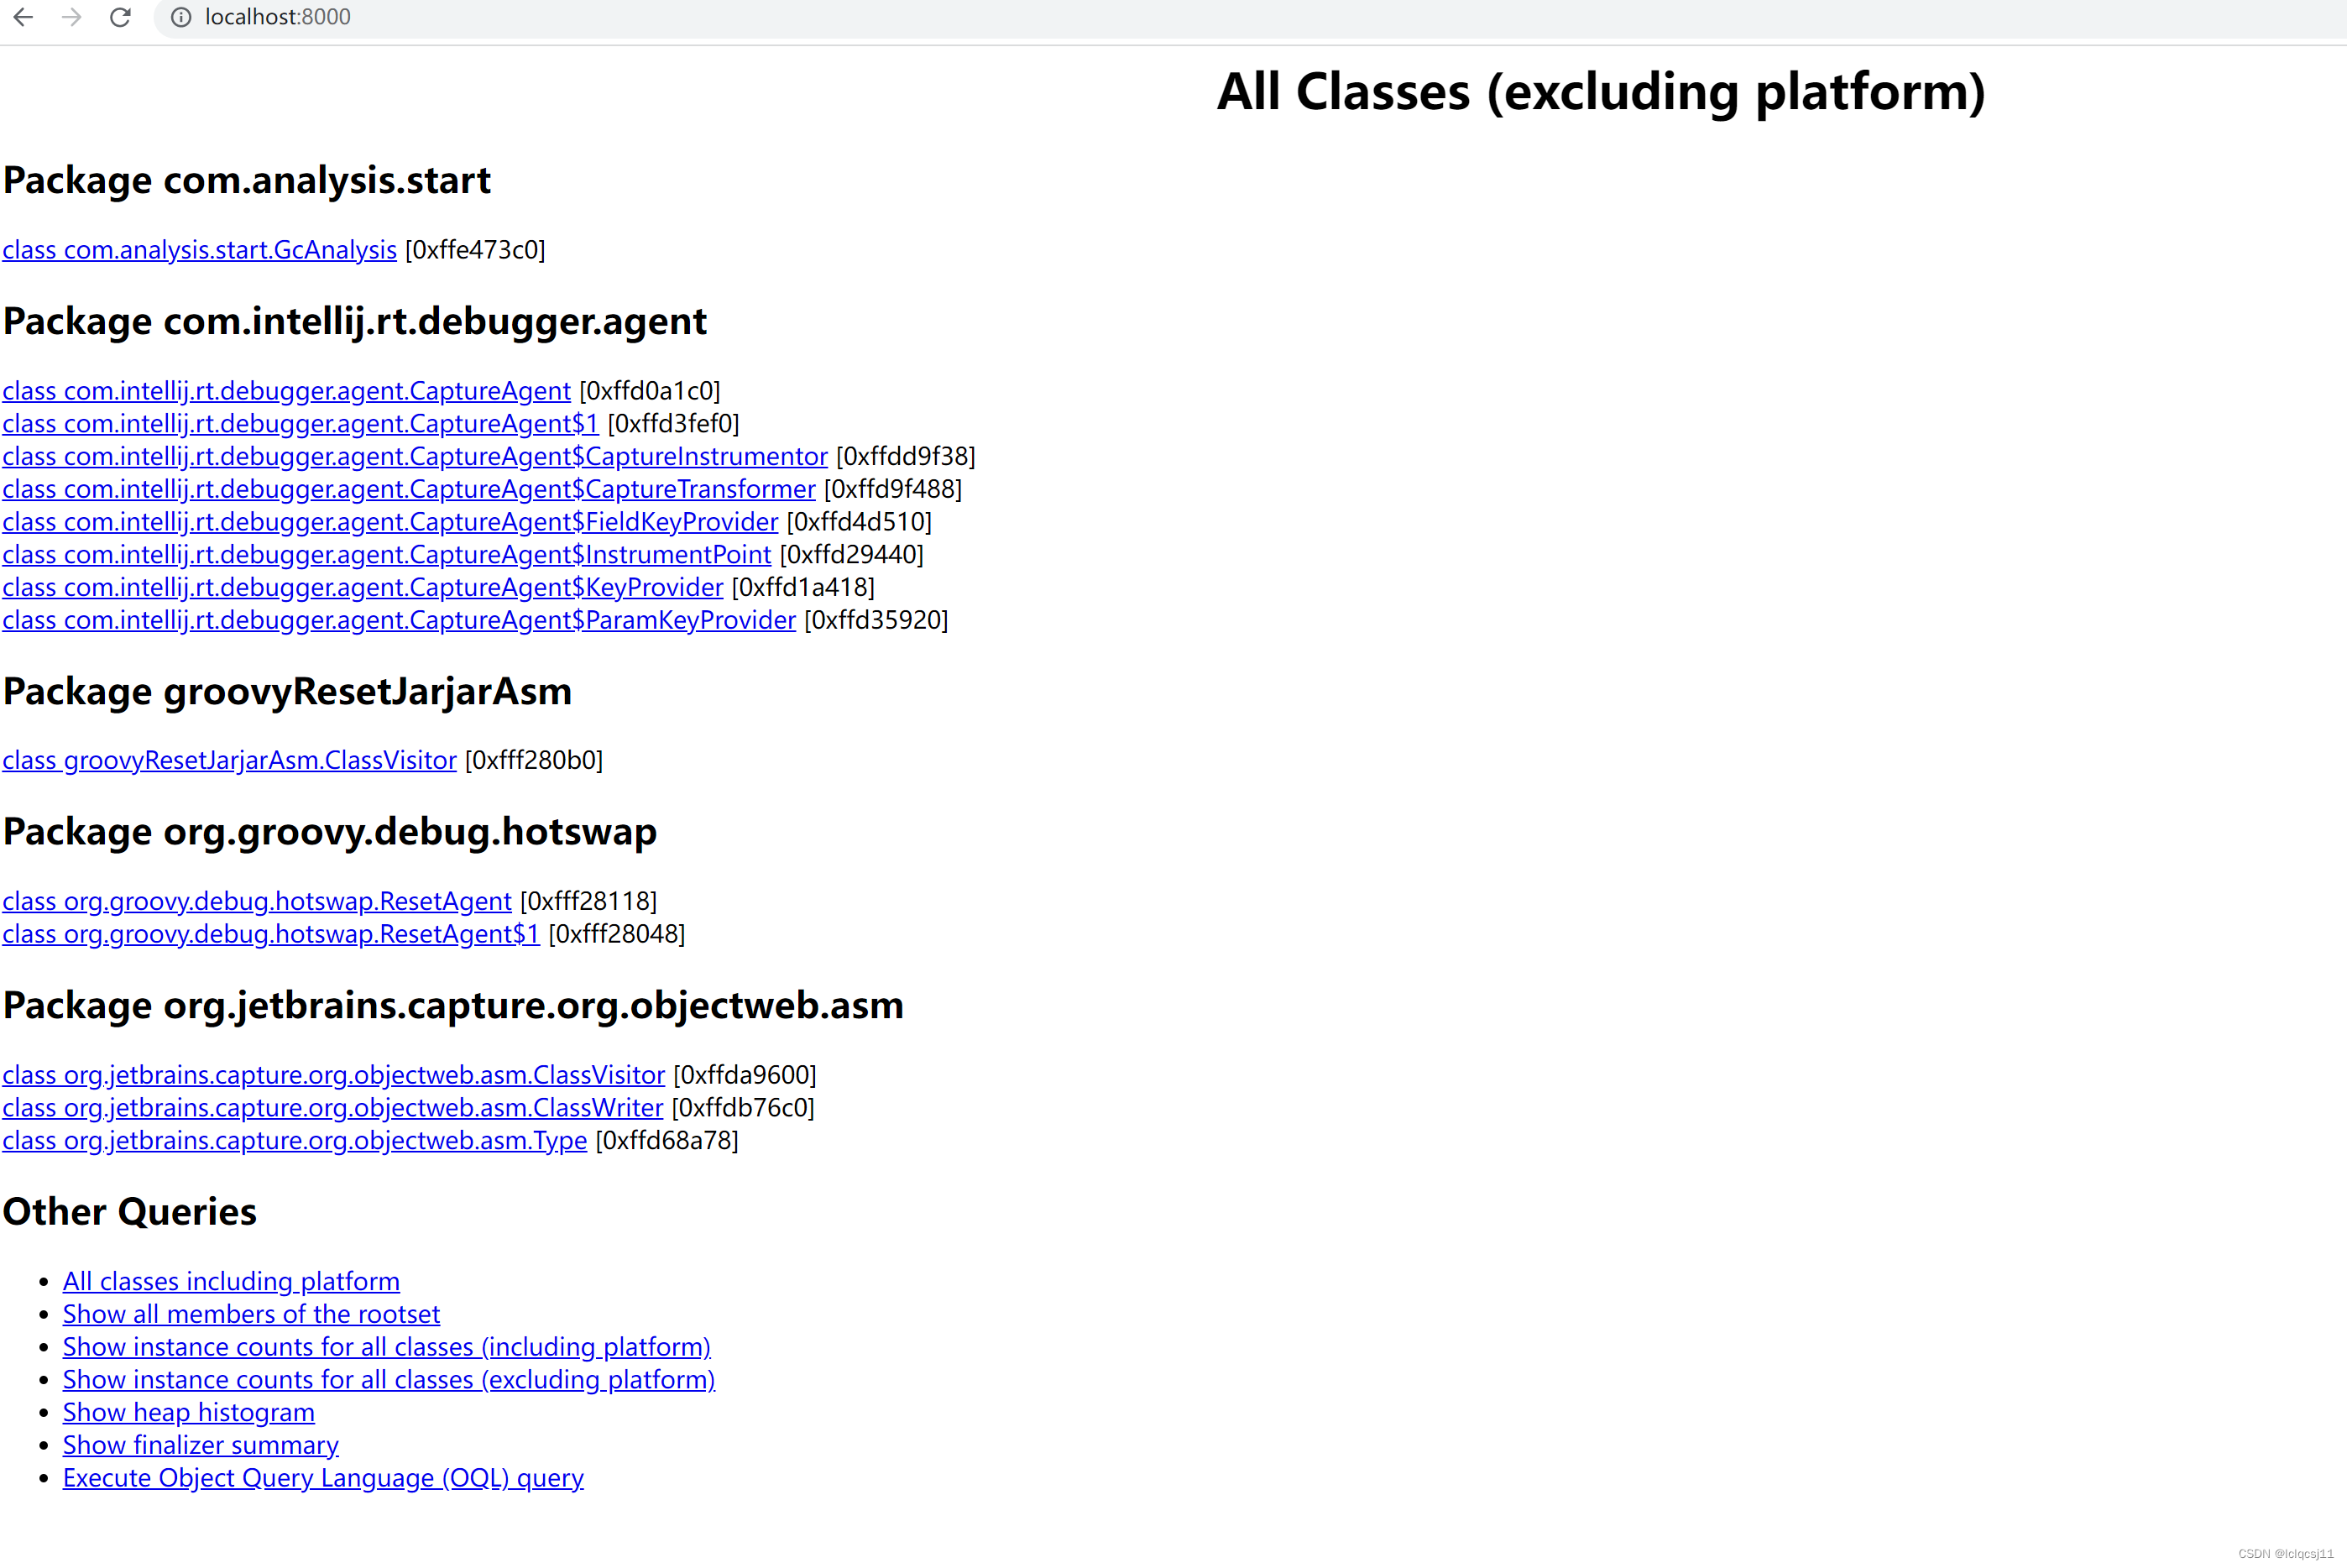
生成快照文件可使用 jhat、VisualVM 等工具查看。
- 使用 jhat 查看时会在本地启动一个服务监听 7000端口,直接访问 localhost:7000 可查看快照信息。
- 使用 VisualVM 查看时,需先安装 VisualVM 插件,可戳 下载。
使用 VisualVM 查看效果如下。
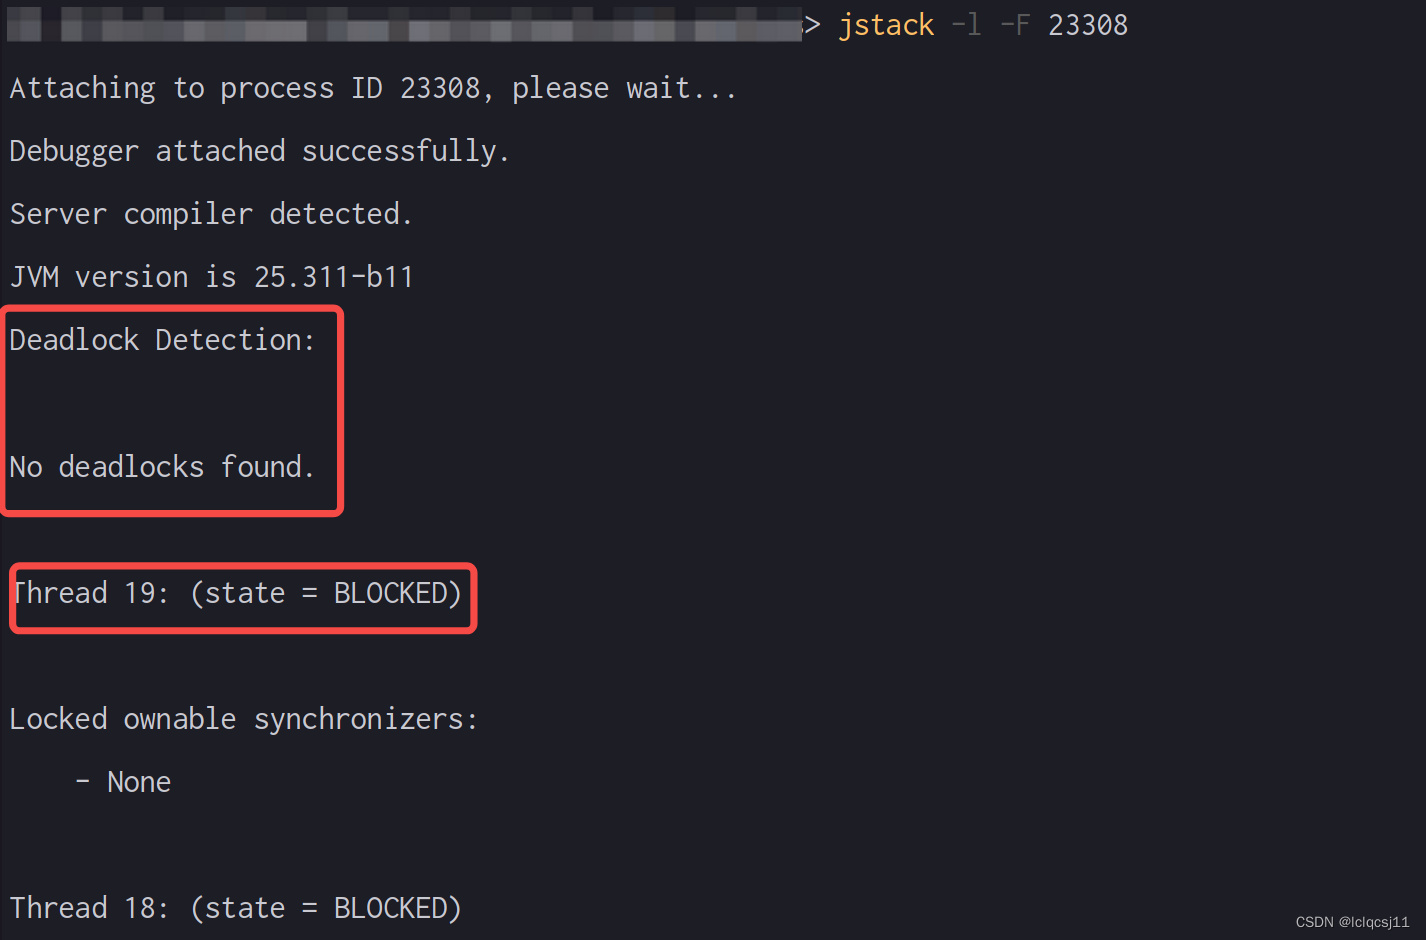
jstack
jstack 与 jmap 类似,可查看或 dump 指定进程的内存信息,除此之外,jstack 还可分析前进程内各个线程的信息,如
- 是否发生死锁
- 线程执行耗时长的原因
- 线程状态
等信息。jstack 使用方式
> jstack -help
Usage:
    jstack [-l] <pid>
        (to connect to running process)
    jstack -F [-m] [-l] <pid>
        (to connect to a hung process)
    jstack [-m] [-l] <executable> <core>
        (to connect to a core file)
    jstack [-m] [-l] [server_id@]<remote server IP or hostname>
        (to connect to a remote debug server)

Options:
    -F  to force a thread dump. Use when jstack <pid> does not respond (process is hung)
    -m  to print both java and native frames (mixed mode)
    -l  long listing. Prints additional information about locks
    -h or -help to print this help message
需要说明的是,jstack 若查看的是 hung(挂起)的进程,需要使用 -F 强制输出,否则看不到任何输出信息。
jhat
jhat 可用于分析 dump 下来的二进制文件。
jhat -help
Usage:  jhat [-stack <bool>] [-refs <bool>] [-port <port>] [-baseline <file>] [-debug <int>] [-version] [-h|-help] <file>

        -J<flag>          Pass <flag> directly to the runtime system. For
                          example, -J-mx512m to use a maximum heap size of 512MB
        -stack false:     Turn off tracking object allocation call stack.
        -refs false:      Turn off tracking of references to objects
        -port <port>:     Set the port for the HTTP server.  Defaults to 7000
        -exclude <file>:  Specify a file that lists data members that should
                          be excluded from the reachableFrom query.
        -baseline <file>: Specify a baseline object dump.  Objects in
                          both heap dumps with the same ID and same class will
                          be marked as not being "new".
        -debug <int>:     Set debug level.
                            0:  No debug output
                            1:  Debug hprof file parsing
                            2:  Debug hprof file parsing, no server
        -version          Report version number
        -h|-help          Print this help and exit
        <file>            The file to read

For a dump file that contains multiple heap dumps,
you may specify which dump in the file
by appending "#<number>" to the file name, i.e. "foo.hprof#3".

All boolean options default to "true"
可根据具体需要,使用不同的参数分析 dump 下课来的文件,如
jstat
jstat 用于查看 jvm 内存回收统计信息,使用方式
> jstat -help
Usage: jstat -help|-options
       jstat -<option> [-t] [-h<lines>] <vmid> [<interval> [<count>]]

Definitions:
  <option>      An option reported by the -options option
  <vmid>        Virtual Machine Identifier. A vmid takes the following form:
                     <lvmid>[@<hostname>[:<port>]]
                Where <lvmid> is the local vm identifier for the target
                Java virtual machine, typically a process id; <hostname> is
                the name of the host running the target Java virtual machine;
                and <port> is the port number for the rmiregistry on the
                target host. See the jvmstat documentation for a more complete
                description of the Virtual Machine Identifier.
  <lines>       Number of samples between header lines.
  <interval>    Sampling interval. The following forms are allowed:
                    <n>["ms"|"s"]
                Where <n> is an integer and the suffix specifies the units as
                milliseconds("ms") or seconds("s"). The default units are "ms".
  <count>       Number of samples to take before terminating.
  -J<flag>      Pass <flag> directly to the runtime system.
乍一看,好像没有看到啥有用参数,其实使用 jstat -options 可查看更多信息。
> jstat -options
-class             // 显示类加载信息
-compiler          // 显示编译信息
-gc                // 显示GC相关信息
-gccapacity        // 显示各区域容量及使用情况
-gccause           // 显示垃圾回收信息
-gcmetacapacity    // 显示元空间容量信息
-gcnew             // 显示新生代信息
-gcnewcapacity     // 显示新生代容量信息
-gcold             // 显示老年代信息
-gcoldcapacity     // 显示老年代容量信息
-gcutil            // 显示垃圾收集信息
-printcompilation  // 显示JIT编译的方法信息
如使用
> jstat -gc pid 2s 5
查看指定 pid 的 Java 进程内存回收信息,每隔 2s 输出一次,共输出 5 次,将得到
> jstat -gc 4280 2s 5
 S0C    S1C    S0U    S1U      EC       EU        OC         OU       MC     MU    CCSC   CCSU   YGC     YGCT    FGC    FGCT     GCT
43520.0 43520.0  0.0    0.0   261120.0 157493.1  441856.0   13949.7   21296.0 20552.0 2944.0 2735.4      1    0.009   1      0.017    0.026
43520.0 43520.0  0.0    0.0   261120.0 157493.1  441856.0   13949.7   21296.0 20552.0 2944.0 2735.4      1    0.009   1      0.017    0.026
43520.0 43520.0  0.0    0.0   261120.0 157493.1  441856.0   13949.7   21296.0 20552.0 2944.0 2735.4      1    0.009   1      0.017    0.026
43520.0 43520.0  0.0    0.0   261120.0 157493.1  441856.0   13949.7   21296.0 20552.0 2944.0 2735.4      1    0.009   1      0.017    0.026
43520.0 43520.0  0.0    0.0   261120.0 157493.1  441856.0   13949.7   21296.0 20552.0 2944.0 2735.4      1    0.009   1      0.017    0.026
输出的信息中,各参数描述见下表。
| 参数 | 描述 |
|---|---|
| S0C | 年轻代中第一个survivor(幸存区)的容量 (字节) |
| S1C | 年轻代中第二个survivor(幸存区)的容量 (字节) |
| S0U | 年轻代中第一个survivor(幸存区)目前已使用空间 (字节) |
| S1U | 年轻代中第二个survivor(幸存区)目前已使用空间 (字节) |
| EC | 年轻代中Eden(伊甸园)的容量 (字节) |
| EU | 年轻代中Eden(伊甸园)目前已使用空间 (字节) |
| OC | Old代的容量 (字节) |
| OU | Old代目前已使用空间 (字节) |
| PC | Perm(持久代)的容量 (字节) |
| PU | Perm(持久代)目前已使用空间 (字节) |
| YGC | 从应用程序启动到采样时年轻代中gc次数 |
| YGCT | 从应用程序启动到采样时年轻代中gc所用时间(s) |
| FGC | 从应用程序启动到采样时old代(全gc)gc次数 |
| FGCT | 从应用程序启动到采样时old代(全gc)gc所用时间(s) |
| GCT | 从应用程序启动到采样时gc用的总时间(s) |


 2181
2181


 暂无认证
暂无认证


 到【灌水乐园】发言


CSDN-Ada助手: 推荐 云原生入门 技能树:https://edu.csdn.net/skill/cloud_native?utm_source=AI_act_cloud_native